
Home › Research › Most Used Software: User Statistics by App (2026)
Research data
How Many People Use Office, Chrome, Teams and ChatGPT? Statistics on the Most Used Software
How many people use Office, Chrome, Teams, ChatGPT and dozens more programs: vendor counts, shares and surveys, with each figure's measure and date.
Key software usage statistics
- ChatGPT had more than 1.2 billion weekly users in October 2026, the highest count published so far.
- Chrome accounted for 66.4% of web page views worldwide in September 2026, across desktops, phones and tablets.
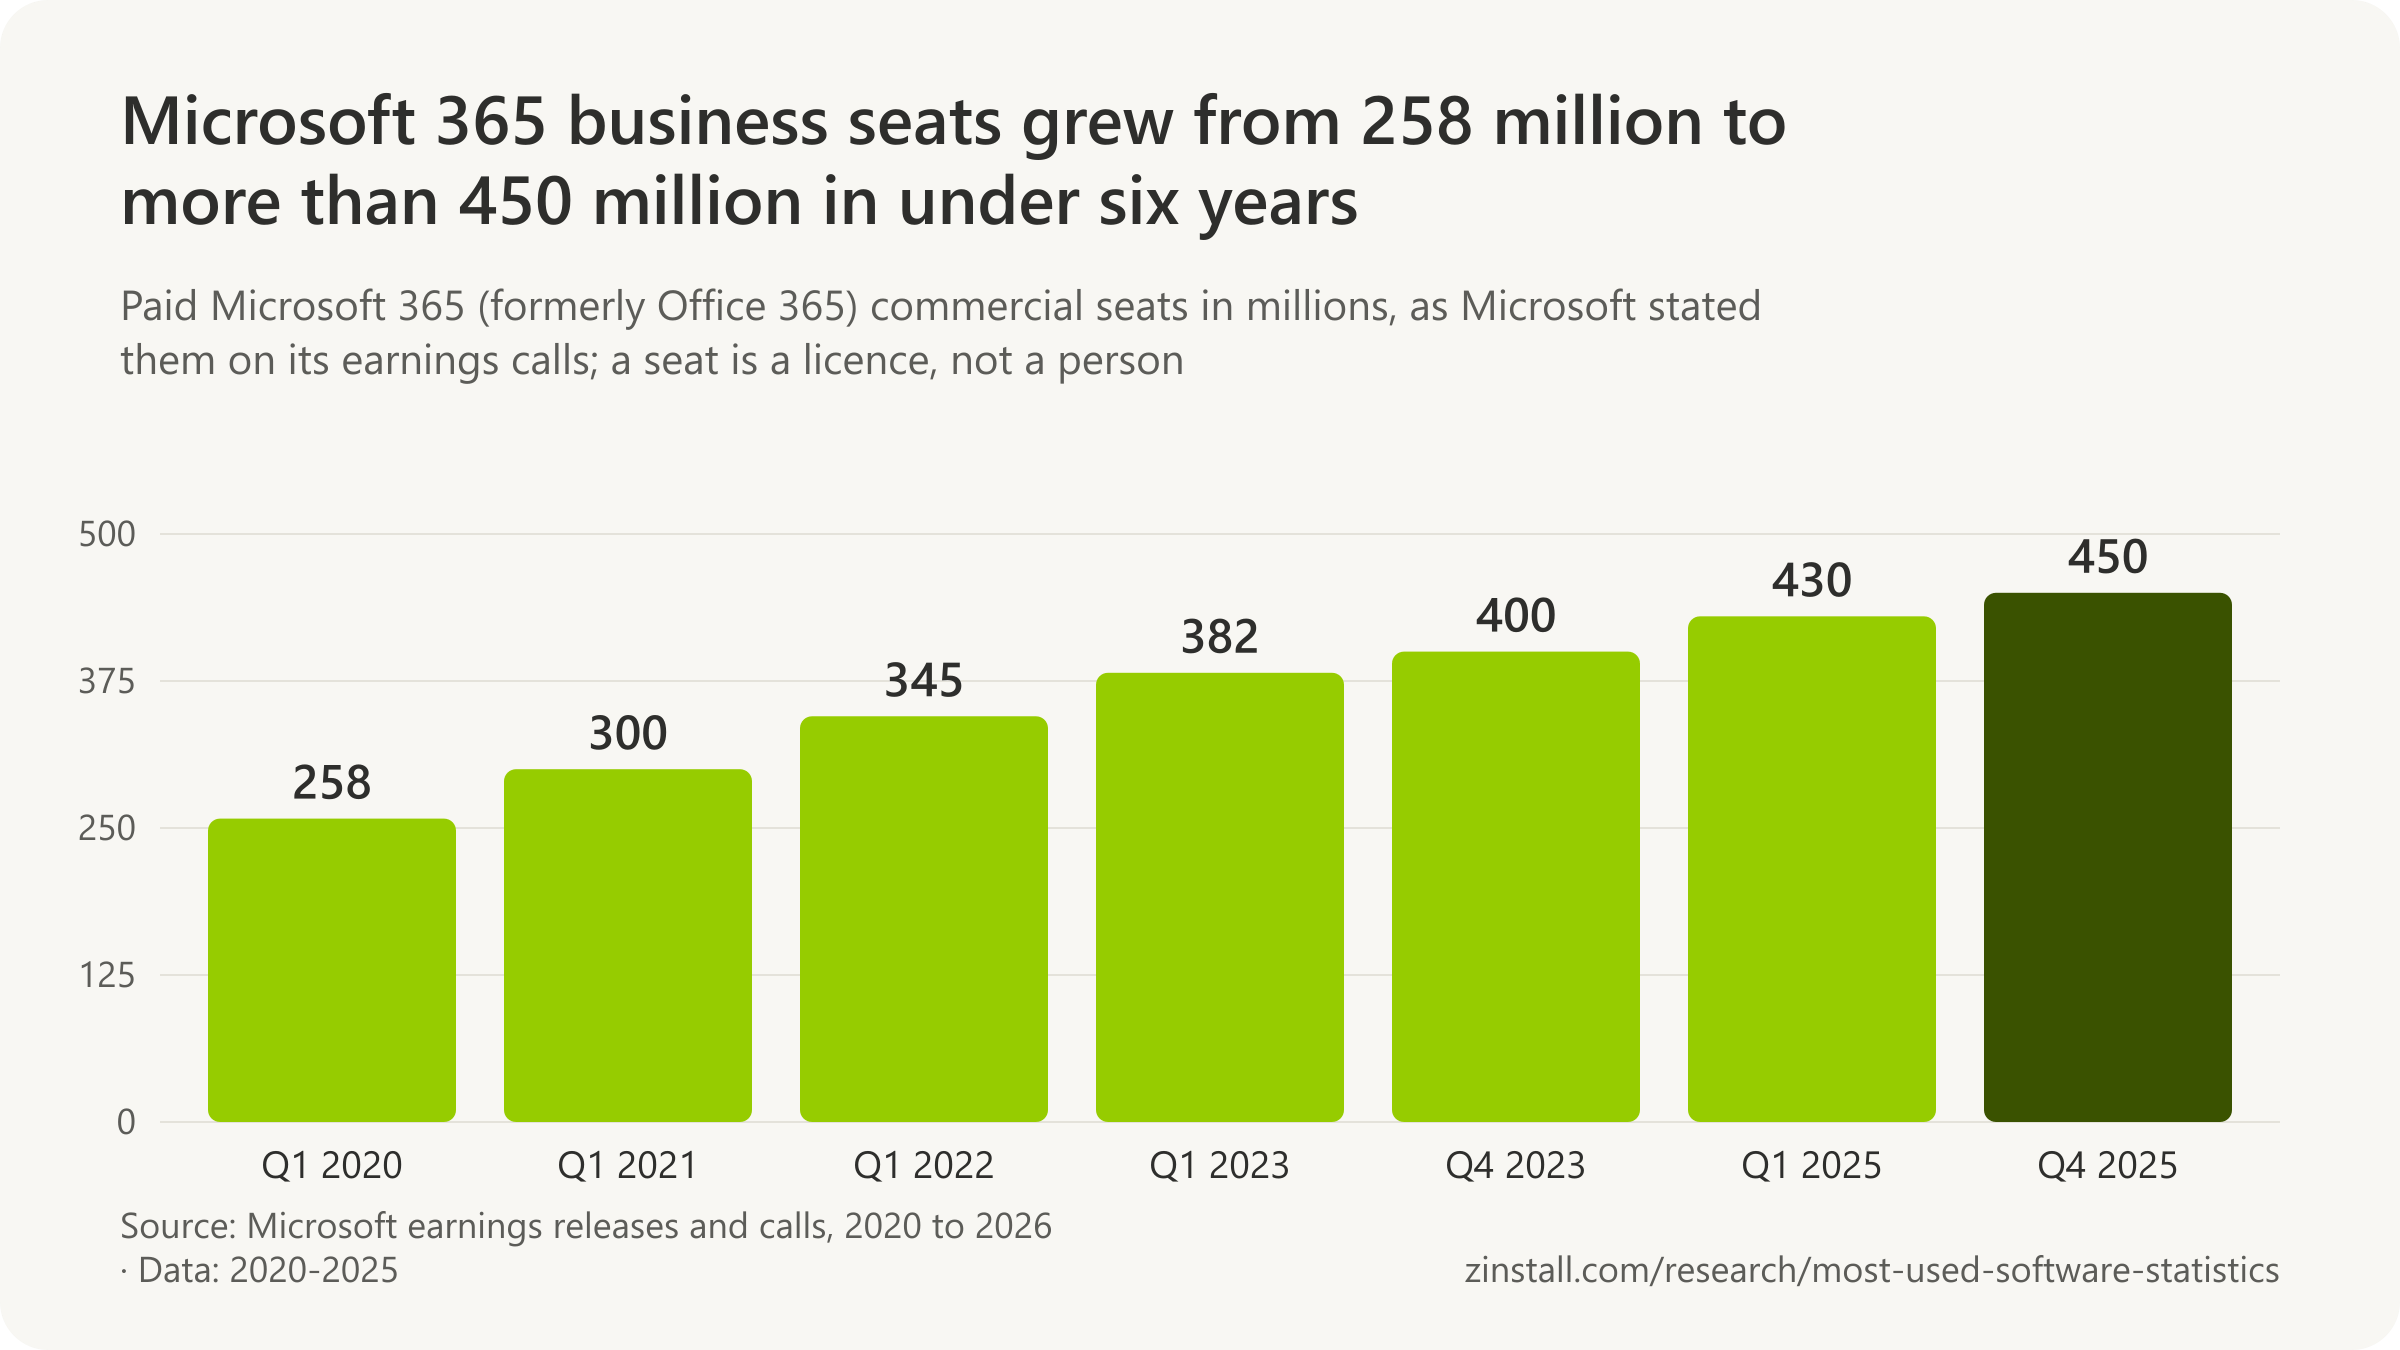
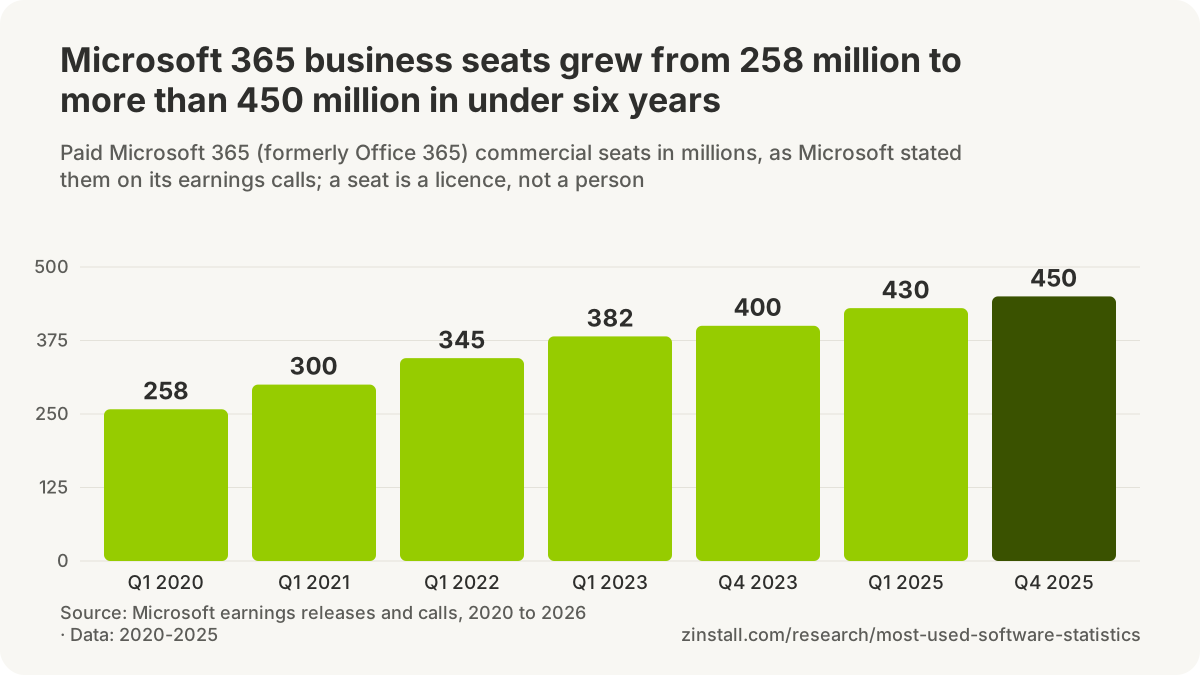
- Microsoft 365 had more than 450 million paid business seats at the end of 2025, its latest count (2026).
- Office 2021 ran on 15% of the on-premises Office PCs at small German firms in September 2026, a month before support ended.
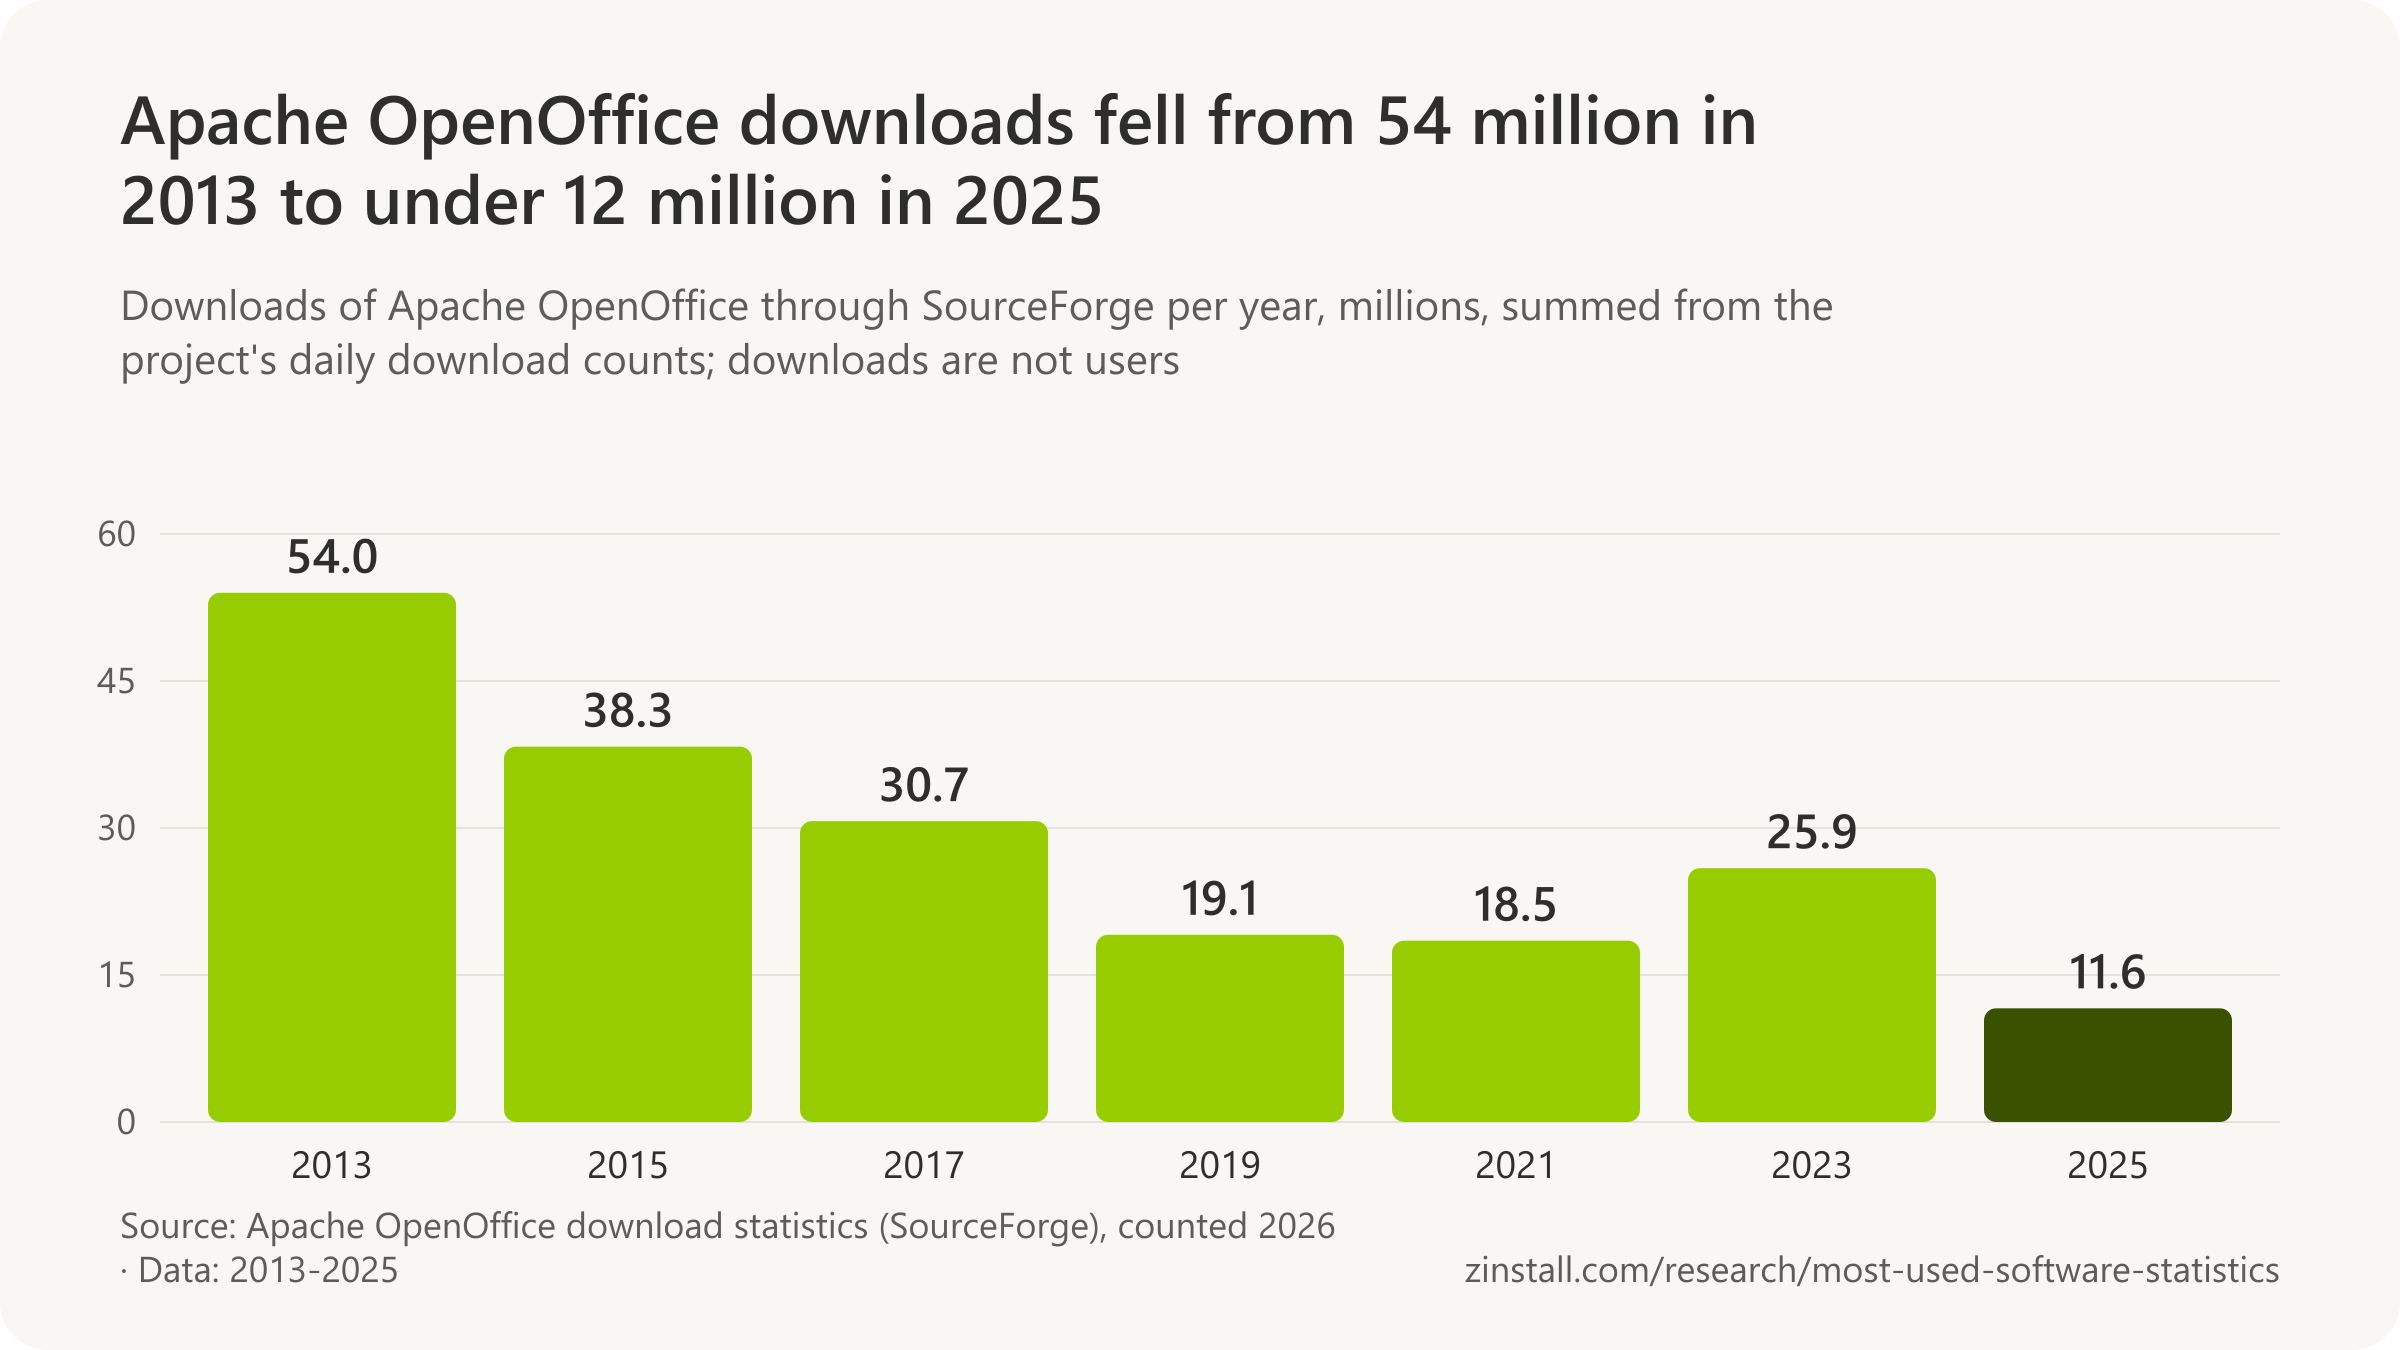
- Apache OpenOffice was downloaded 11.6 million times in 2025, down from 54.0 million in 2013; it publishes no count of users (2026).
- Microsoft Teams had more than 320 million monthly users in 2023, the last count published.
- Microsoft 365 was the No. 1 app among Okta's business customers in 2025, ahead of Google Workspace, AWS, Salesforce and Zoom (2026).
- Acrobat, Express, Creative Cloud and Firefly together had more than 1 billion monthly users in mid-2026.
Sources: OpenAI; StatCounter; Microsoft (2026, 2023); Intra2net AG; Apache OpenOffice; Okta; Adobe
Ask how many people use Microsoft Office, Chrome or ChatGPT and the answer depends on who is counting, and what. Microsoft counts paid seats, Google and OpenAI count users, StatCounter counts page views, Litmus counts email opens, Okta counts business customers and download counters count downloads. This page collects what each of them has published for the programs people search for most, with the measure, the date and the source named for every figure, so a number can be quoted without being stretched. It does not rank all software in one list: no source counts every program on every computer, and figures in different measures cannot be added up or sorted together.
What is the most used software on PCs?
Google Chrome was installed on 91% of PCs in 2018, the most of any program, in the last published census of installed software (Avast, 2019).

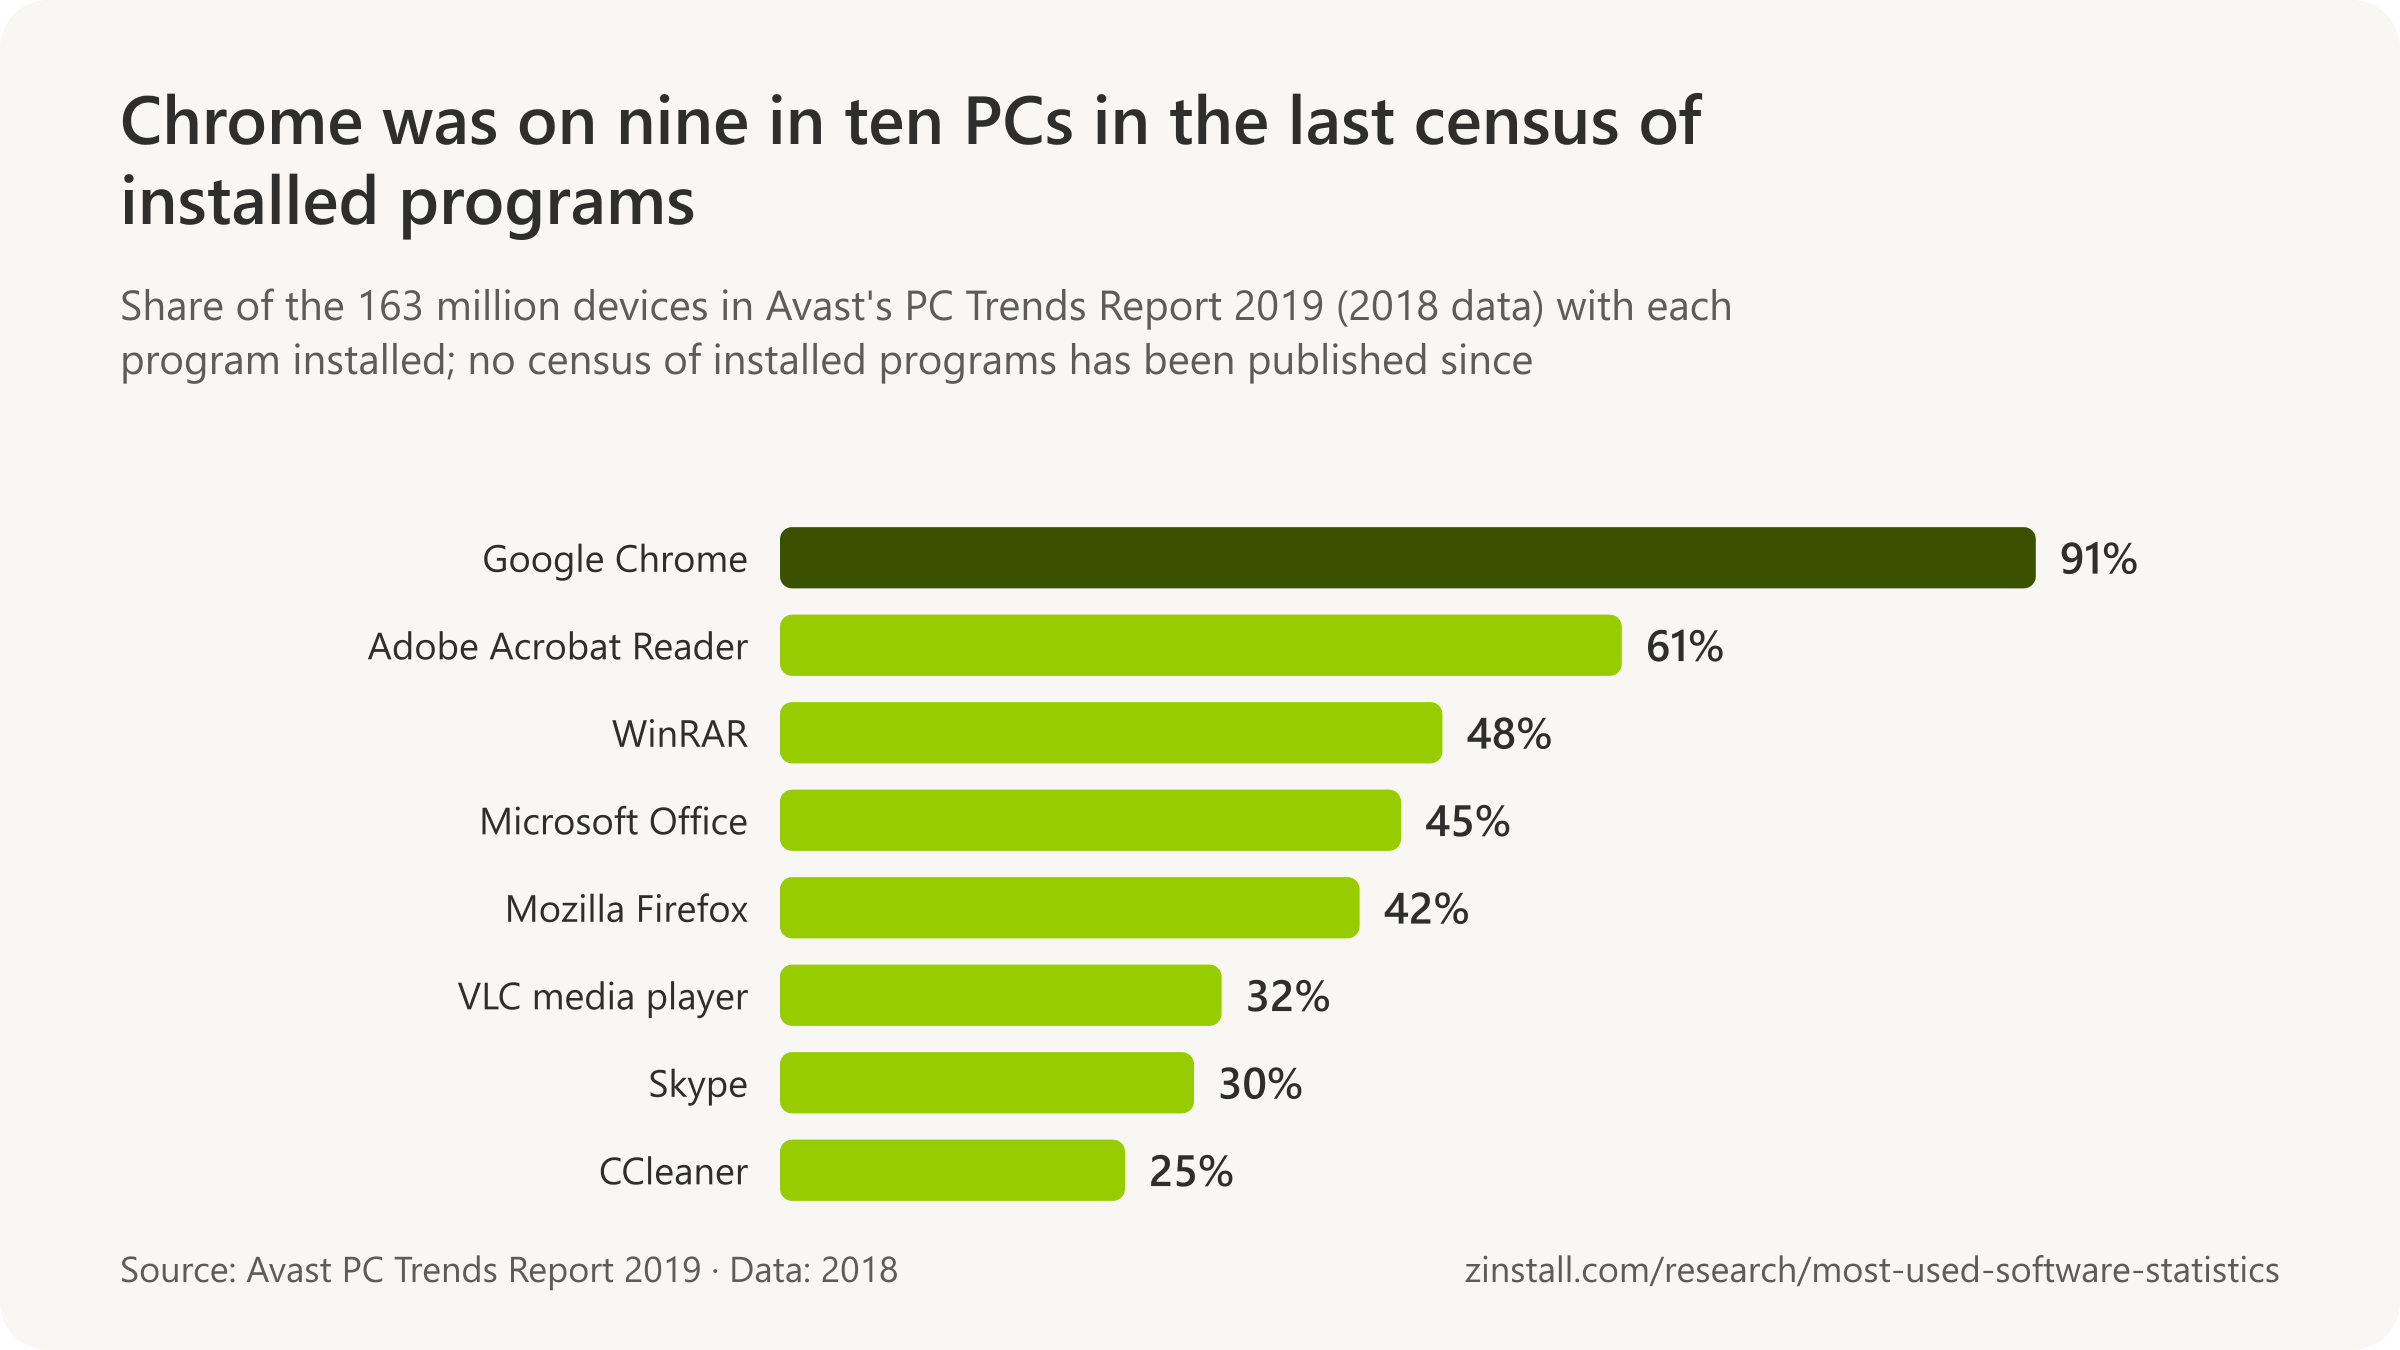
- Adobe Acrobat Reader was on 61% of PCs in a 2018 census of installed software, WinRAR on 48% and Microsoft Office on 45%.
- A 2018 census of installed software covered 163 million PCs running Avast or AVG security software.
- 55% of the applications on the PCs in a 2018 census of installed software were out of date.
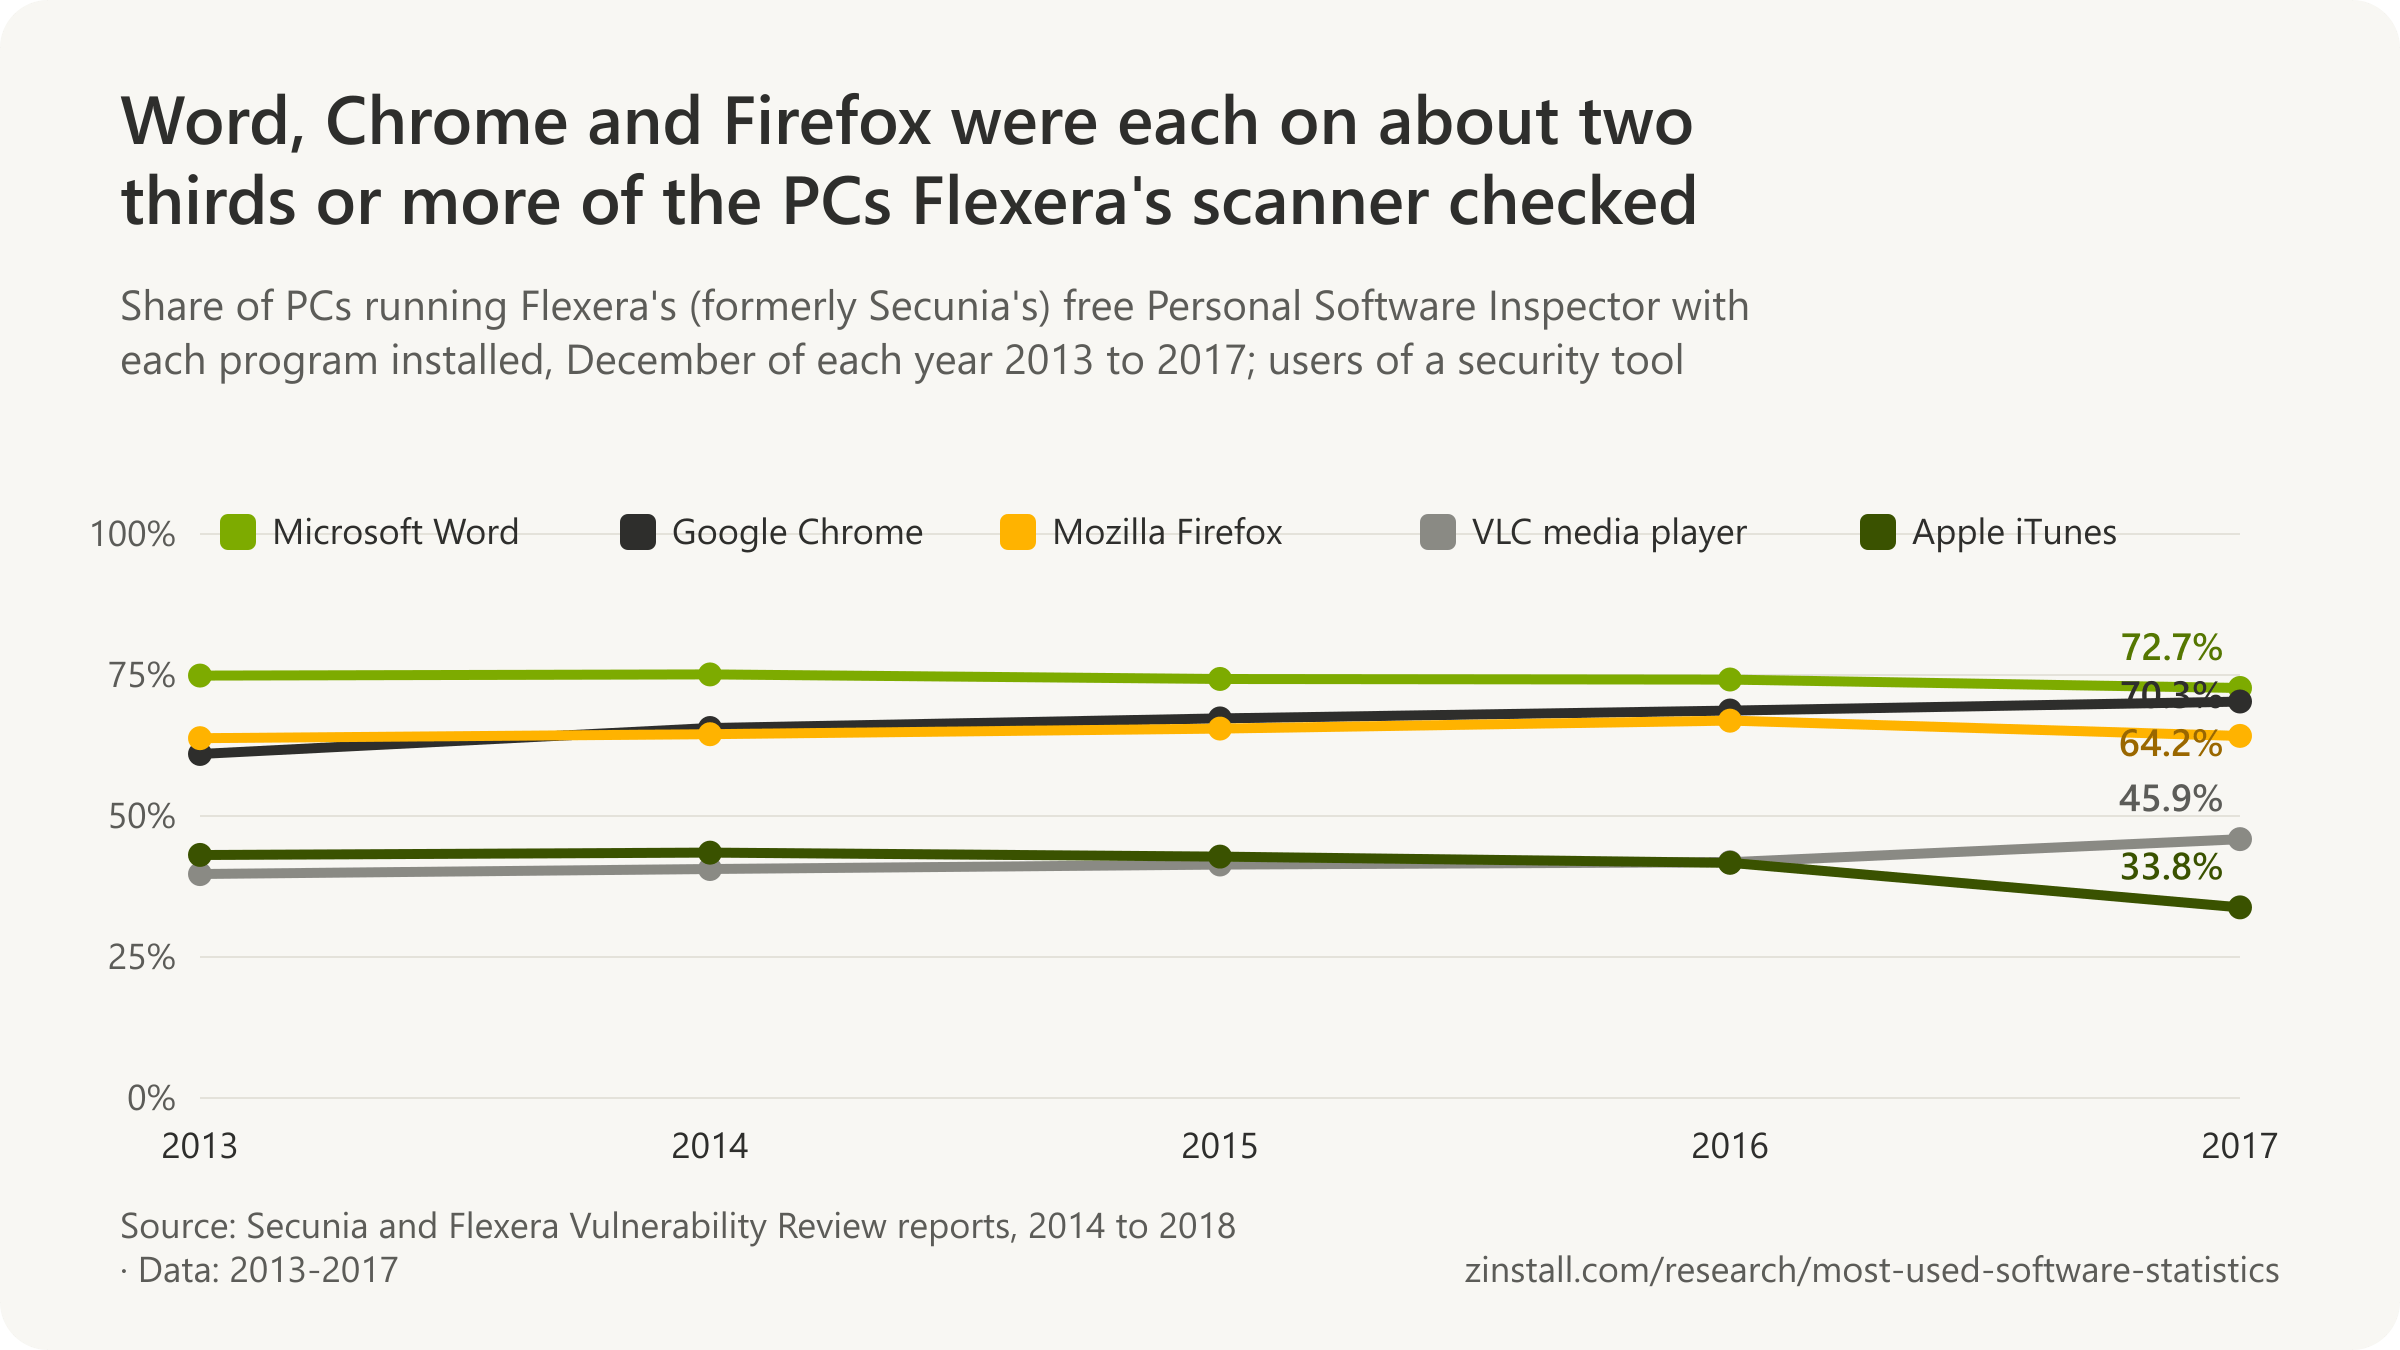
- On PCs running Flexera's free update checker, Microsoft Word was installed on 72.7% at the end of 2017.
- Adobe Acrobat Reader is the most downloaded Windows package on Chocolatey, at 694.6 million downloads.
| Program, measure and year | Count |
|---|---|
| Google Chrome: active browsers, 2016 | over 2 billion |
| Windows: monthly active devices, 2026 | 1.6 billion |
| Gmail: monthly active users, 2018 | more than 1.5 billion |
| Google Drive: monthly active users, 2019 | over 1 billion |
| Spotify: monthly active users, 2026 | 777 million |
| Dropbox: registered users, 2026 | more than 700 million |
| Adobe Acrobat: monthly active users, 2025 | more than 650 million |
| Norton, Avast and AVG (Gen Digital): users, 2026 | approximately 500 million |
| Outlook.com: active accounts, 2013 | over 400 million accounts |
| Skype: monthly active users, 2019 | more than 300 million |
Sources: Avast (2019a, 2019b); Flexera; Chocolatey Software; Google; Microsoft (2026, 2019, 2013); Alphabet (2020, 2018); Spotify Technology S.A.; Dropbox; Adobe; Gen Digital
Moving these programs to a new computer: Google Chrome · Adobe Acrobat · Microsoft Office · Firefox · iTunes · Parallels Desktop
More statistics (165)
No one counts the programs on every computer. The closest things are the scans security software runs on its own users' PCs: Avast's PC Trends reports and Flexera's (formerly Secunia's) yearly reviews of the PCs running its free update checker. Both have stopped publishing these lists, so the latest census of installed programs is from 2018 data. Package managers and download counters show what people install now, each in its own measure.
Avast PC Trends: the programs on the most PCs
| Program | Share of PCs |
|---|---|
| Google Chrome | 91% |
| Adobe Acrobat Reader | 61% |
| WinRAR | 48% |
| Microsoft Office | 45% |
| Mozilla Firefox | 42% |
| VLC media player | 32% |
| Skype | 30% |
| CCleaner | 25% |
| iTunes | 18% |
| TeamViewer | 18% |
| Windows Live Essentials | 16% |
| 7-Zip | 14% |
| Steam | 11% |
| Dropbox | 11% |
| Opera | 11% |
| CyberLink PowerDVD | 10% |
| CyberLink PowerDirector | 10% |
| HP Photo Creations | 9% |
| CyberLink YouCam | 8% |
| CyberLink Power2Go | 7% |
| Program | Share of PCs |
|---|---|
| Google Chrome | 79% |
| Adobe Flash Player | 77% |
| Java | 59% |
| Mozilla Firefox | 44% |
| Skype | 39% |
| WinRAR | 35% |
| VLC media player | 31% |
| Adobe Reader | 27% |
| CCleaner | 23% |
| iTunes | 19% |
| TeamViewer | 16% |
| Adobe Shockwave Player | 14% |
| CyberLink PowerDVD | 10% |
| Steam | 10% |
| Opera | 9% |
| CyberLink PowerDirector | 9% |
| CyberLink YouCam | 9% |
| QuickTime | 8% |
| Google Earth | 8% |
| CyberLink Power2Go | 7% |
- 163 million devices running Avast or AVG security software supplied the anonymised data behind Avast's PC Trends Report 2019, the largest of the three PC Trends editions (Avast, 2019).
- 55% of PC applications installed worldwide were out of date in Avast's PC Trends Report 2019, based on 163 million devices (Avast, 2019).
- 155 million users (118 million Avast and 37 million AVG) supplied the anonymised data behind Avast's PC Trends Report Q3 2017 (Avast, 2017).
- 48% of the instances of popular and security-critical programs (browsers, Skype, Adobe Reader, Flash) on the PCs in Avast's Q3 2017 sample of 155 million users were out of date (Avast, 2017).
- 51 programs were installed on the average PC in Avast's Q3 2017 sample of 155 million users, with Korea (79) and Japan (73) highest and Pakistan (29) lowest (Avast, 2017).
- 85% of VLC Media Player users in Avast's Q3 2017 sample ran an older version or had automatic updates disabled (Avast, 2017).
- 71% of Firefox users in Avast's Q3 2017 sample were not running the latest version of the browser (Avast, 2017).
- 56% of 7-Zip users in Avast's Q3 2017 sample had an outdated version, down from 82% at the end of 2016 (Avast, 2017).
- 55% of WinRAR installations in Avast's Q3 2017 sample were outdated, as the program does not update itself (Avast, 2017).
- 75% of iTunes installations in Avast's Q3 2017 sample were outdated (Avast, 2017).
- Google Chrome was the most installed program on the PCs in Avast's January 2017 sample of 116 million Windows users, ahead of Adobe Reader and Flash Player (ActiveX); the PC Trends Report Q1 2017 gives ranks but no shares (Avast, 2017).
- 116 million Windows users supplied the anonymised software, memory and disk data behind Avast's PC Trends Report Q1 2017, sampled in January 2017 (Avast, 2017).
- 52% of the most popular PC applications, including Flash and Java, were out of date on the PCs in Avast's January 2017 sample of 116 million Windows users (Avast, 2017).
- 49 programs were installed on the average PC in Avast's January 2017 sample of 116 million Windows users (Avast, 2017).
- 88% of Google Chrome installations in Avast's January 2017 sample were up to date, the best record of any program, ahead of Opera (84%) and Skype (76%) (Avast, 2017).
- 82% of 7-Zip users in Avast's January 2017 sample of 116 million Windows users ran an out-of-date version (Avast, 2017).
- 73% of Firefox users in Avast's January 2017 sample of 116 million Windows users ran an out-of-date version of the browser (Avast, 2017).
- 96% of Adobe Shockwave installations on the PCs in Avast's 2018 sample were out of date, number 1 on the report's list of most out-of-date programs (Avast, 2019).
- 94% of VLC Media Player installations on the PCs in Avast's 2018 sample were out of date, number 2 on the report's list of most out-of-date programs (Avast, 2019).
- 94% of Skype installations on the PCs in Avast's 2018 sample were out of date, number 3 on the report's list of most out-of-date programs (Avast, 2019).
- 92% of 7-Zip installations on the PCs in Avast's 2018 sample were out of date, number 5 on the report's list of most out-of-date programs (Avast, 2019).
- 85% of Mozilla Firefox installations on the PCs in Avast's 2018 sample were out of date, number 9 on the report's list of most out-of-date programs (Avast, 2019).
- 77% of iTunes installations on the PCs in Avast's 2018 sample were out of date, number 12 on the report's list of most out-of-date programs (Avast, 2019).
- 71% of WinRAR installations on the PCs in Avast's 2018 sample were out of date, number 15 on the report's list of most out-of-date programs (Avast, 2019).
Flexera and Secunia: programs on the PCs their scanner checked

| Program and year | Share of PCs |
|---|---|
| Adobe Reader, 2013 | 85.6% |
| Adobe Reader, 2014-12 | 85.3% |
| Adobe Reader, 2015-12 | 81.1% |
| Adobe Reader, 2016-12 | 49.8% |
| Adobe Acrobat, 2016-12 | 45.0% |
| Adobe Acrobat, 2017-12 | 59.2% |
| Windows Defender, 2013 | 77.1% |
| Windows Defender, 2014-12 | 81.0% |
| Windows Defender, 2015-12 | 82.8% |
| Windows Defender, 2016-12 | 66.1% |
| Windows Defender, 2017-12 | 47.3% |
| 7-Zip, 2017-12 | 36.0% |
| Microsoft OneDrive, 2017-12 | 58.4% |
| Malwarebytes, 2017-12 | 27.9% |
- 75 programs were installed on the average private PC running Secunia's Personal Software Inspector in 2013, according to Secunia's Vulnerability Review 2014 (Secunia, 2014).
- 76 programs were installed on the average private PC running Secunia's Personal Software Inspector during 2014, according to Secunia's Vulnerability Review 2015 (Secunia, 2015).
- 79 programs were installed on the average private PC running Secunia's Personal Software Inspector during 2015, according to Flexera's Vulnerability Review 2016 (Flexera, 2016).
- 75 programs were installed on the average private PC running Secunia's Personal Software Inspector during 2016, according to Flexera's Vulnerability Review 2017 (Flexera, 2017).
- 70 programs were installed on the average private PC running Secunia's Personal Software Inspector during 2017, according to Flexera's Vulnerability Review 2018 (Flexera, 2018).
- 16% of US private PCs running Flexera's Personal Software Inspector still had Google Picasa 3.x installed in March 2017, a year after Google retired it, making it the tenth most common end-of-life program (Flexera, 2017).
- 13% of US private PCs running Flexera's Personal Software Inspector had Apple iCloud for Windows 6.x installed in March 2017 (Flexera, 2017).
- 30% of US private PCs running Flexera's Personal Software Inspector had Malwarebytes Anti-Malware 2.x installed in March 2017 (Flexera, 2017).
- 73 programs from 26 vendors were installed on the average US private PC running Flexera's Personal Software Inspector in March 2017, 42 of them from non-Microsoft vendors (Flexera, 2017).
Package managers and download counters
| Package | Downloads |
|---|---|
| Adobe Acrobat Reader | 694.6 million |
| Google Chrome | 394.1 million |
| Mozilla Firefox | 111.7 million |
| Microsoft 365 Apps for business | 46.3 million |
| TeamViewer | 50.5 million |
| Notepad++ | 48.2 million |
| 7-Zip | 45.8 million |
| Google Drive | 27.1 million |
| VLC media player | 22.6 million |
| WinRAR | 11.9 million |
| Malwarebytes | 10.6 million |
| Dropbox | 9.6 million |
| AnyDesk | 1.9 million |
- 4.8 billion package downloads had been served by Chocolatey's community repository for Windows by 14 October 2026, across 12,270 unique packages (Chocolatey, 2026).
| Program | Installs |
|---|---|
| Claude Code | 1,161,939 |
| Google Chrome | 434,998 |
| LibreOffice | 371,285 |
| Microsoft Office | 17,798 |
| Mozilla Firefox | 185,832 |
| VLC media player | 121,386 |
| Google Drive | 41,659 |
| Microsoft OneDrive | 18,047 |
| Dropbox | 16,780 |
| AnyDesk | 18,769 |
| TeamViewer | 13,270 |
| Parallels Desktop | 5,546 |
| Malwarebytes | 4,004 |
- 25.2 million Mac app (cask) install events were recorded by Homebrew's opt-out analytics in the 365 days to 14 October 2026, spread over 26,054 casks (Homebrew, 2026).

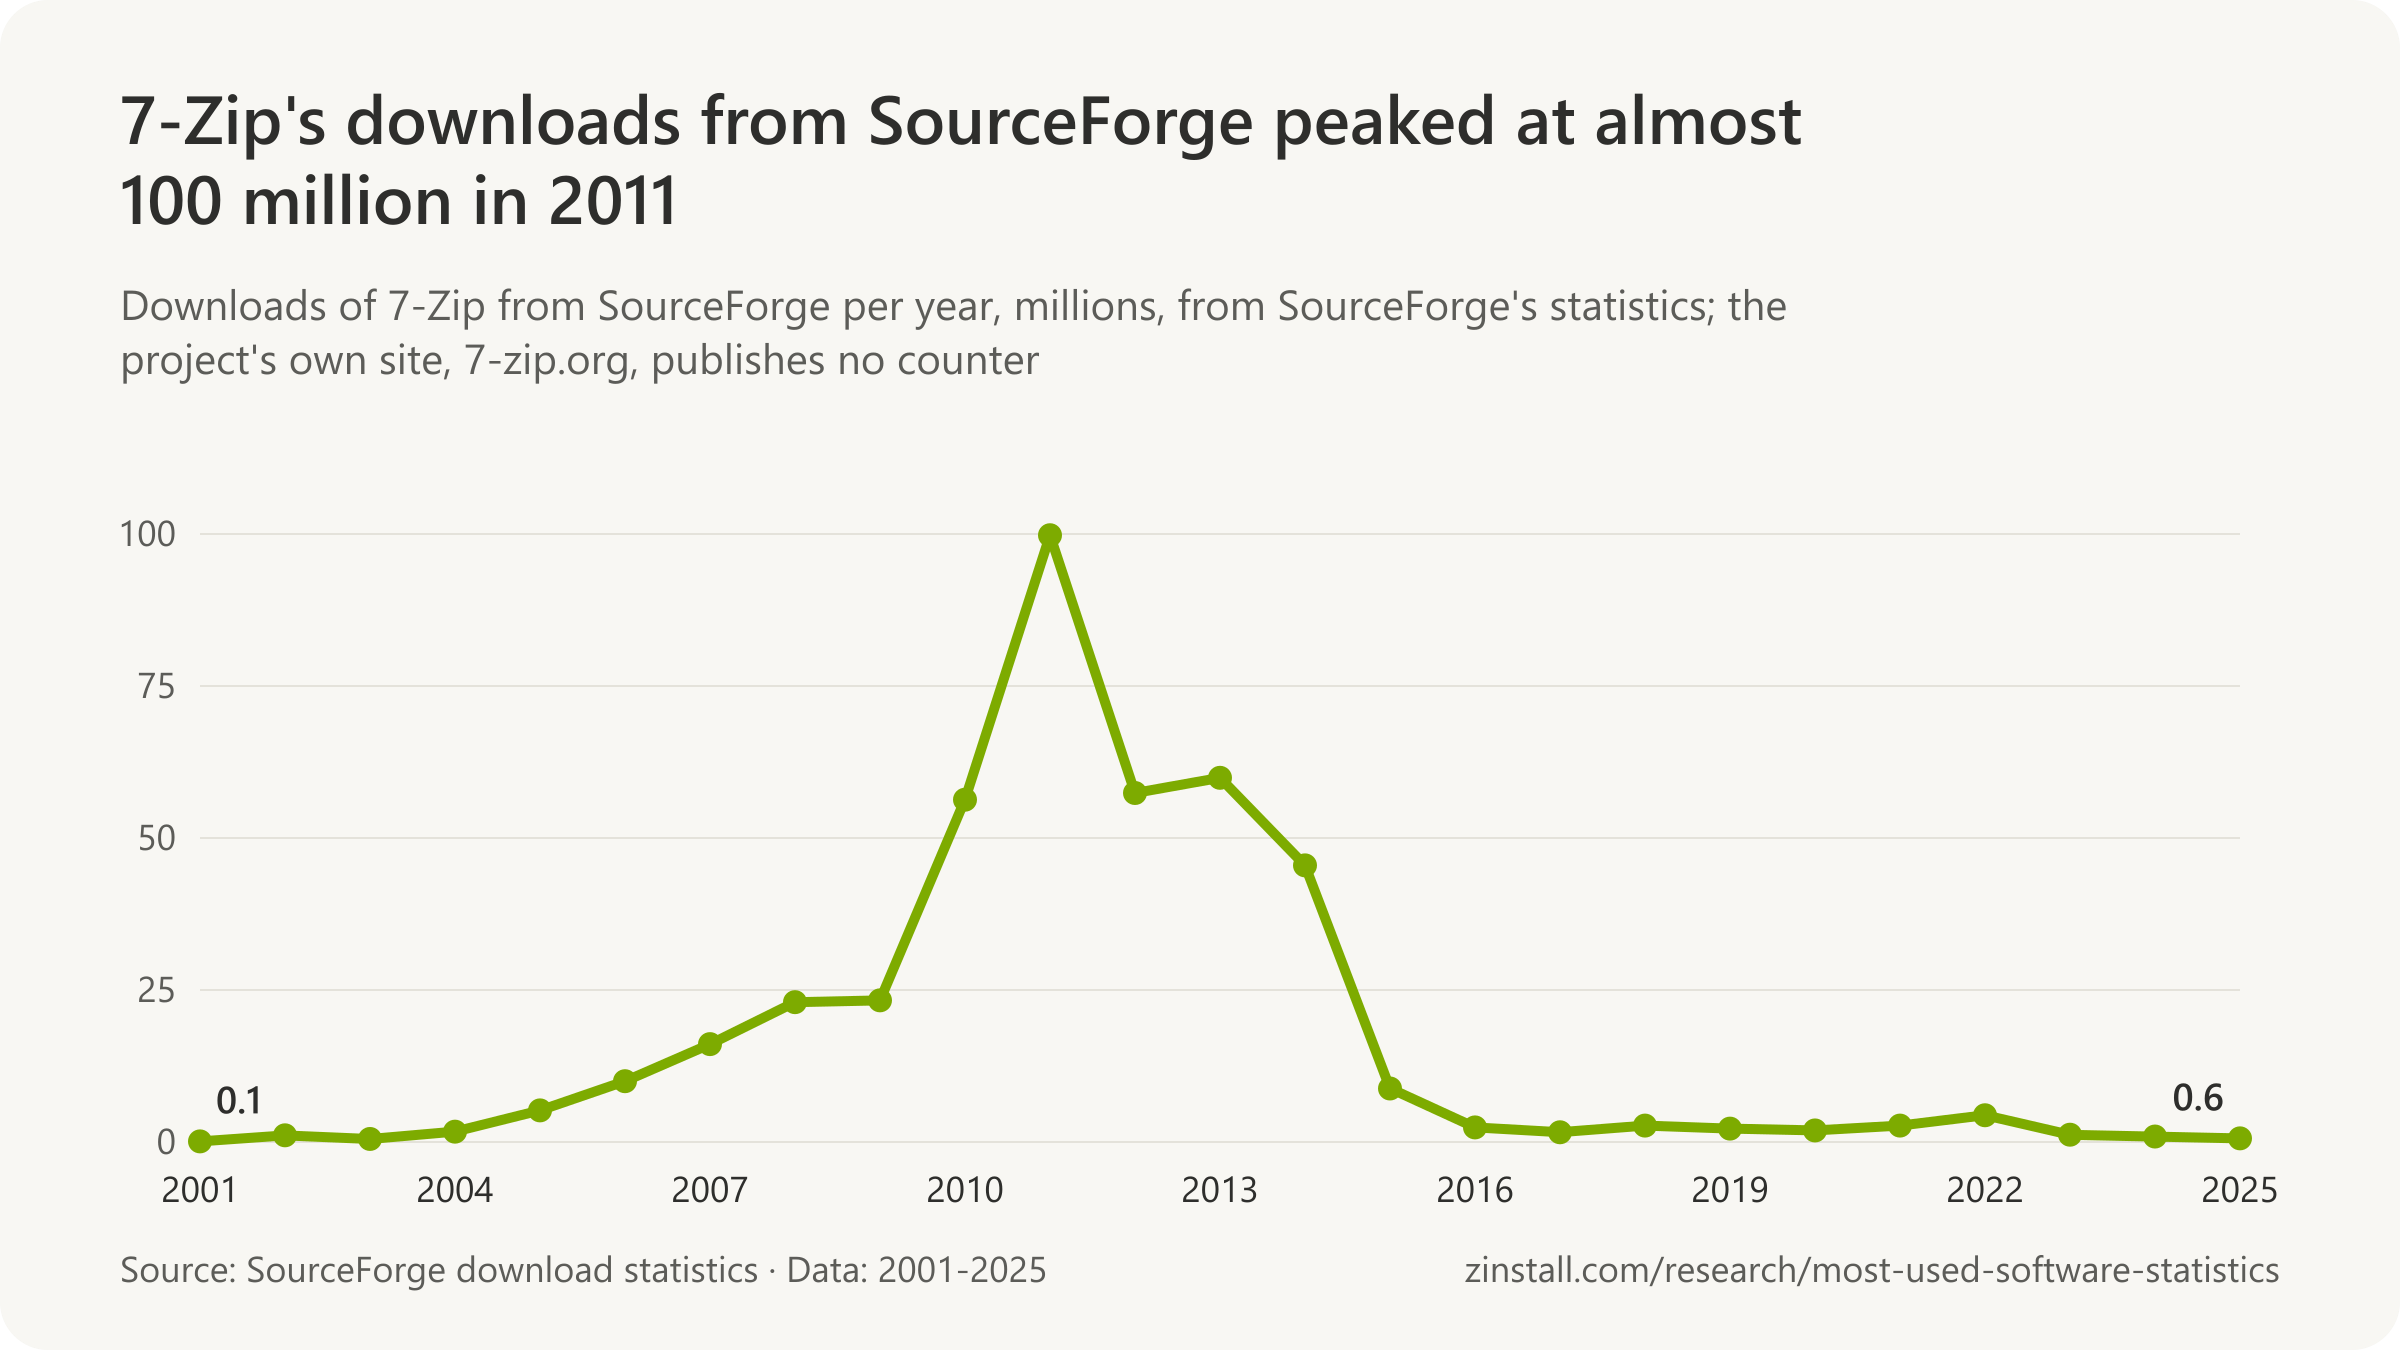
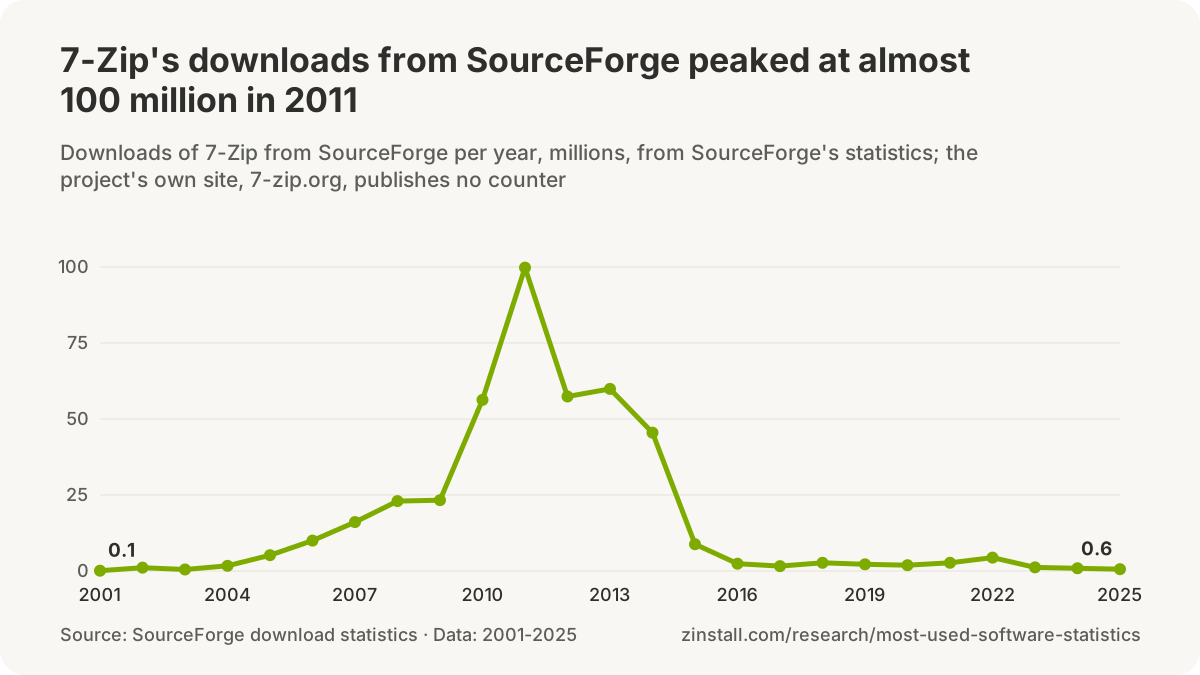
- 430.2 million downloads of 7-Zip had been counted by SourceForge between the project's registration in November 2000 and 13 October 2026, a count that misses the downloads 7-Zip's own site has served since about 2015 (SourceForge, 2026).
- 99.8 million downloads of 7-Zip were counted by SourceForge in 2011, the peak year, before the count fell to 8.8 million in 2015 as downloads moved to 7-Zip's own site (SourceForge, 2026).
- 880,916 downloads of 7-Zip were counted by SourceForge in the twelve months from October 2025 to September 2026, a small share of 7-Zip's downloads now that most come from 7-zip.org (SourceForge, 2026).
- 27.8% of developers answering Stack Overflow's 2026 Developer Survey said they used Notepad++ regularly over the past year, second only to Visual Studio Code (70.9%) among development environments and code editors (Stack Overflow, 2026).
- 27.4% of developers answering Stack Overflow's 2025 Developer Survey said they used Notepad++ regularly over the past year, third after Visual Studio Code (75.9%) and Visual Studio (29%) (Stack Overflow, 2025).
- 360.4 million downloads of Notepad++ release files had been counted by GitHub by 14 October 2026, across 145 releases since the project began hosting its installers there in 2019 (GitHub, 2026).
- 29.2 million downloads of Notepad++ were counted by SourceForge while the project hosted its files there, from November 2003 until 2015 (SourceForge, 2026).
- Over 500 million users worldwide is RARLAB's claim for WinRAR on its website in October 2026, a figure unchanged since at least June 2012 (win.rar GmbH, 2026).
- Over 500 million users worldwide was already RARLAB's claim for WinRAR in June 2012, the earliest archived copy of its start page with the figure (win.rar GmbH, 2012).
- No install or user count has been published for Microsoft's Windows Package Manager (winget); at its version 1.0 launch in May 2021 Microsoft gave only the size of its community repository, over 1,400 packages (Microsoft, 2021).
Remote access: TeamViewer and AnyDesk
- More than 2 billion devices had TeamViewer installed and activated by June 2019, each with a unique TeamViewer ID, double the 1 billion of October 2015, the company said (TeamViewer, 2019).
- Over 2.5 billion devices had had TeamViewer installed by May 2022, with up to 45 million online at any given time, according to TeamViewer's company page at the time (TeamViewer, 2022).
- Over 400 million devices run TeamViewer, of which at least 30 million are connected at any time, TeamViewer says on its knowledge-base page last modified in May 2026 (TeamViewer, 2026).
- 637,000 paying customers with an active TeamViewer subscription were counted at the end of 2025, down 5% from 669,000 a year earlier, in TeamViewer's 2025 annual report (TeamViewer, 2026).
- About 500 million downloads of AnyDesk had been made by October 2021, seven years after its launch, the last download count the company has published (AnyDesk, 2021).
- Over 200,000 customers trust AnyDesk, the company says on its home page in October 2026, up from the over 80,000 customers it cited in October 2021 (AnyDesk, 2026).
Cloud storage: Dropbox, Google Drive, OneDrive, iCloud and Box

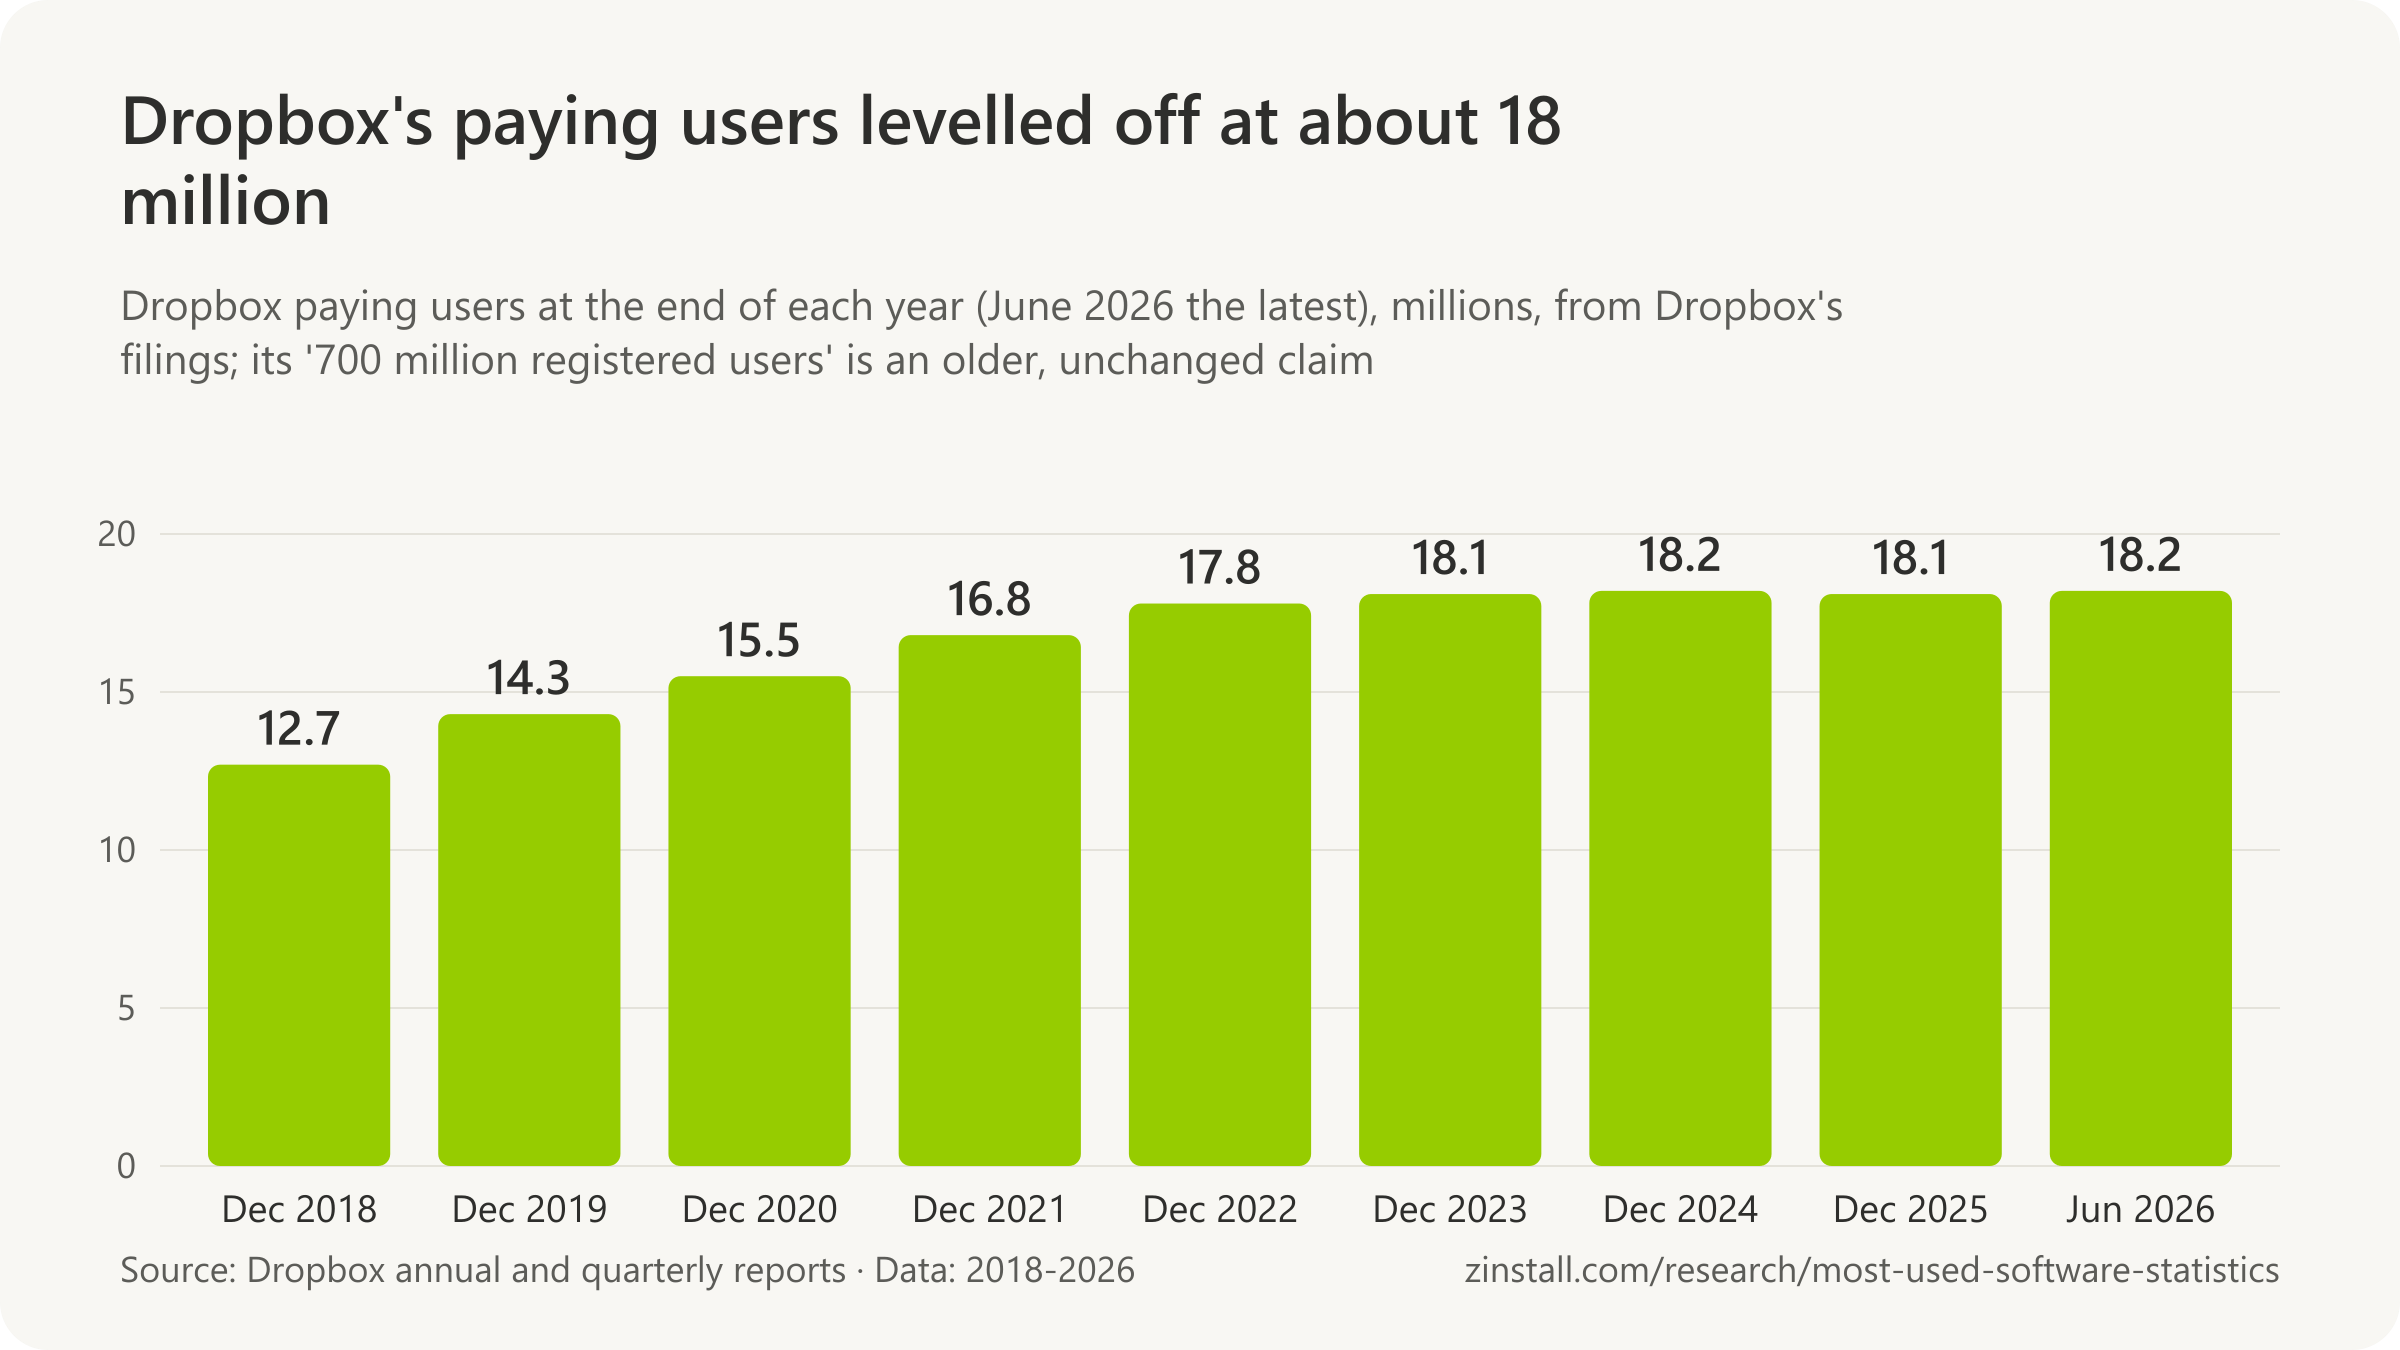
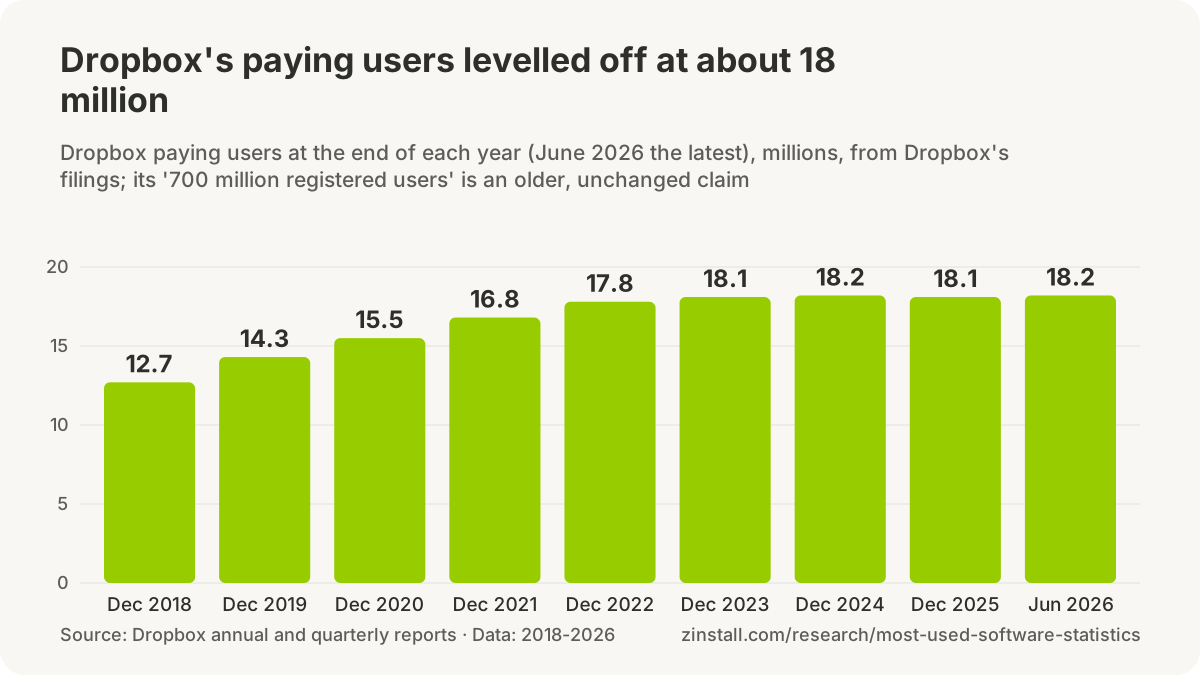
- More than 500 million registered users of Dropbox across about 180 countries was the figure in Dropbox's company description in 2019 (Dropbox, 2019).
- More than 600 million registered users of Dropbox across about 180 countries was the figure in Dropbox's company description in 2020 (Dropbox, 2020).
- More than 700 million registered users of Dropbox across about 180 countries was the figure in Dropbox's company description in August 2026, unchanged since February 2021 (Dropbox, 2026).
- Over 1 billion monthly active users of Google Drive was the level Alphabet gave in its annual report for 2019, the last time a filing named Drive among Google's billion-user products (Alphabet, 2020).
- 1 billion users was the milestone Google said Google Drive would pass 'later this week' at its Cloud Next conference in July 2018, making Drive its eighth service with a billion users (TechCrunch, 2018).
- 782 million iCloud users was the count Apple's Eddy Cue gave in February 2016, the latest iCloud user figure from an Apple executive that this research found (AppleInsider, 2016).
- 850 million iCloud users, about 170 million of them paying, was Barclays analysts' estimate in February 2018, not an Apple figure (CNBC, 2018).
- 250 million OneDrive users was the count Microsoft's Tony Prophet gave in a Computex keynote in June 2014, the last absolute OneDrive user figure from Microsoft that this research found (BetaNews, 2014).
- 240% more monthly active users of OneDrive in five years is the growth Microsoft reported for OneDrive's fifteenth anniversary in August 2022, without an absolute count (Microsoft, 2022).
- Over 100,000 paying organizations used Box at 31 January 2026, the end of its fiscal 2026, by Box's count in its annual report (Box, 2026).
Security software
- 15.9% of the anti-malware market on the devices OPSWAT monitored in October 2015 was Microsoft's, the largest share of any vendor, ahead of Avast (15.0%) and Malwarebytes (11.6%), in the last OPSWAT report that counted Microsoft (OPSWAT, 2015).
- More than 500 million PCs worldwide used Microsoft Defender in August 2019, Microsoft corporate vice president Brad Anderson said, the most recent device count from Microsoft for its built-in antivirus that this research found (Microsoft, 2019).
- Microsoft Defender was the fourth most used desktop anti-malware product among 1,328 respondents to AV-Comparatives' 2026 security survey, after ESET, Bitdefender and Kaspersky; the survey publishes ranks, not shares (AV-Comparatives, 2026).
- Approximately 500 million users of Gen Digital's products (Norton, Avast, AVG, Avira, LifeLock and MoneyLion) were counted at 3 April 2026, from direct, partner and free channels (Gen Digital, 2026).
- 79 million paid customers of Gen Digital were counted at 3 April 2026, up from 68 million a year earlier, a count that now includes MoneyLion's financial-app customers (Gen Digital, 2026).
- 81 million paid customers of Gen Digital were counted at 3 July 2026, up from 76 million a year earlier, the latest figure in Gen's earnings releases (Gen Digital, 2026).
- Over 23 million direct customers of NortonLifeLock (Norton, LifeLock and Avira) were counted at 1 April 2022, out of nearly 80 million total users, the last Norton-family count before the Avast merger (NortonLifeLock, 2022).
- More than 435 million users of Avast's free and paid products were counted in 2020, each a device that had contacted Avast's servers in the previous 30 days, in Avast's 2020 annual report (Avast, 2021).
- 13.6 million paying desktop customers of Avast were counted at the end of 2020, up 7.9% in the year, against more than 435 million users of its free and paid products (Avast, 2021).
- 15.6 million paying customers of Avast's Consumer Direct products were counted at 30 June 2022, down 4.4% in a year, in Avast's results for the first half of 2022, its last before the NortonLifeLock takeover (Avast, 2022).
- Approximately 193 million active users of AVG's products were counted at the end of 2015, including about 102 million on mobile devices, in AVG's last annual report before Avast bought it (AVG, 2016).
- 20 million subscription users paid for AVG's premium products at the end of 2015, about one in ten of its 193 million active users (AVG, 2016).
- 20.7 million core direct-to-consumer subscribers paid McAfee at the end of 2021, up from 18.0 million a year earlier, in its last annual report before its take-private sale (McAfee, 2022).
- Over 600 million devices were protected by McAfee's consumer products at the end of 2021, the company said, counting PCs, phones and home-network devices (McAfee, 2022).
- 400 million users protected by Kaspersky's technologies, with 250,000 corporate clients, was the figure on Kaspersky's company page in June 2024, a claim it has since dropped (Kaspersky, 2024).
- Over a billion devices have been protected by Kaspersky since 1997, its press-release boilerplate said in October 2026, a cumulative figure rather than a count of current users (Kaspersky, 2026).
Parallels Desktop
- More than 1 million customers used Parallels Desktop worldwide in early 2026, Parallels chief executive Christa Quarles said when Corel announced its split into two companies (Parallels, 2026).
- More than seven million Mac users have chosen Parallels Desktop to run Windows, Parallels says on its company page in October 2026, wording unchanged since at least June 2021 (Parallels, 2026).
- More than five million copies of Parallels Desktop had been sold by May 2020, Parallels said on its company page, before it switched to counting 'Mac users' (Parallels, 2020).
Numbers in circulation
- More than 2 billion monthly active users of Google Drive is the figure a widely copied statistics roundup gives, without a Google source; Wikipedia's Google Drive infobox cites that roundup for '2 billion (Dec 2024)' (Exploding Topics, 2023).
- Over 700 million users per month is how a widely copied statistics roundup restates Dropbox's 'more than 700 million registered users', turning accounts ever created into monthly users (Exploding Topics, 2023).
- About 850 million members is the iCloud figure in Wikipedia's infobox ('as of 2018'), which traces to a Barclays analysts' estimate reported by CNBC, not to Apple (Wikipedia, 2026).
- 60% of the PCs Avast analysed had Chrome installed in 2017, up from 25% in 2015, a Brazilian outlet wrote of Avast's Q3 2017 report, misreading two browser-usage shares the report quoted from another tracker; Avast's own install figure was 79% (Olhar Digital, 2018).
Sources: Avast (2017, 2019); Secunia (2014, 2015); Flexera (2016, 2017, 2018); Chocolatey Software (2026); Homebrew; SourceForge (2026); Stack Overflow (2025, 2026); GitHub; win.rar GmbH (2012, 2026); Microsoft (2021, 2022); TeamViewer (2019, 2022, 2026); AnyDesk Software (2021, 2026); Dropbox (2019-2026); Alphabet; TechCrunch; AppleInsider; CNBC; BetaNews; Box; OPSWAT; Borns IT- und Windows-Blog; Windows Latest; AV-Comparatives; Gen Digital (2026); NortonLifeLock; Avast plc (2021, 2022); AVG Technologies; McAfee; Kaspersky (2024, 2026); Parallels International GmbH; Parallels; Exploding Topics; Wikipedia; Olhar Digital
How many people use Microsoft Office and Microsoft 365?
Microsoft 365 had more than 450 million paid business seats at the end of 2025, its latest count (Microsoft, 2026).

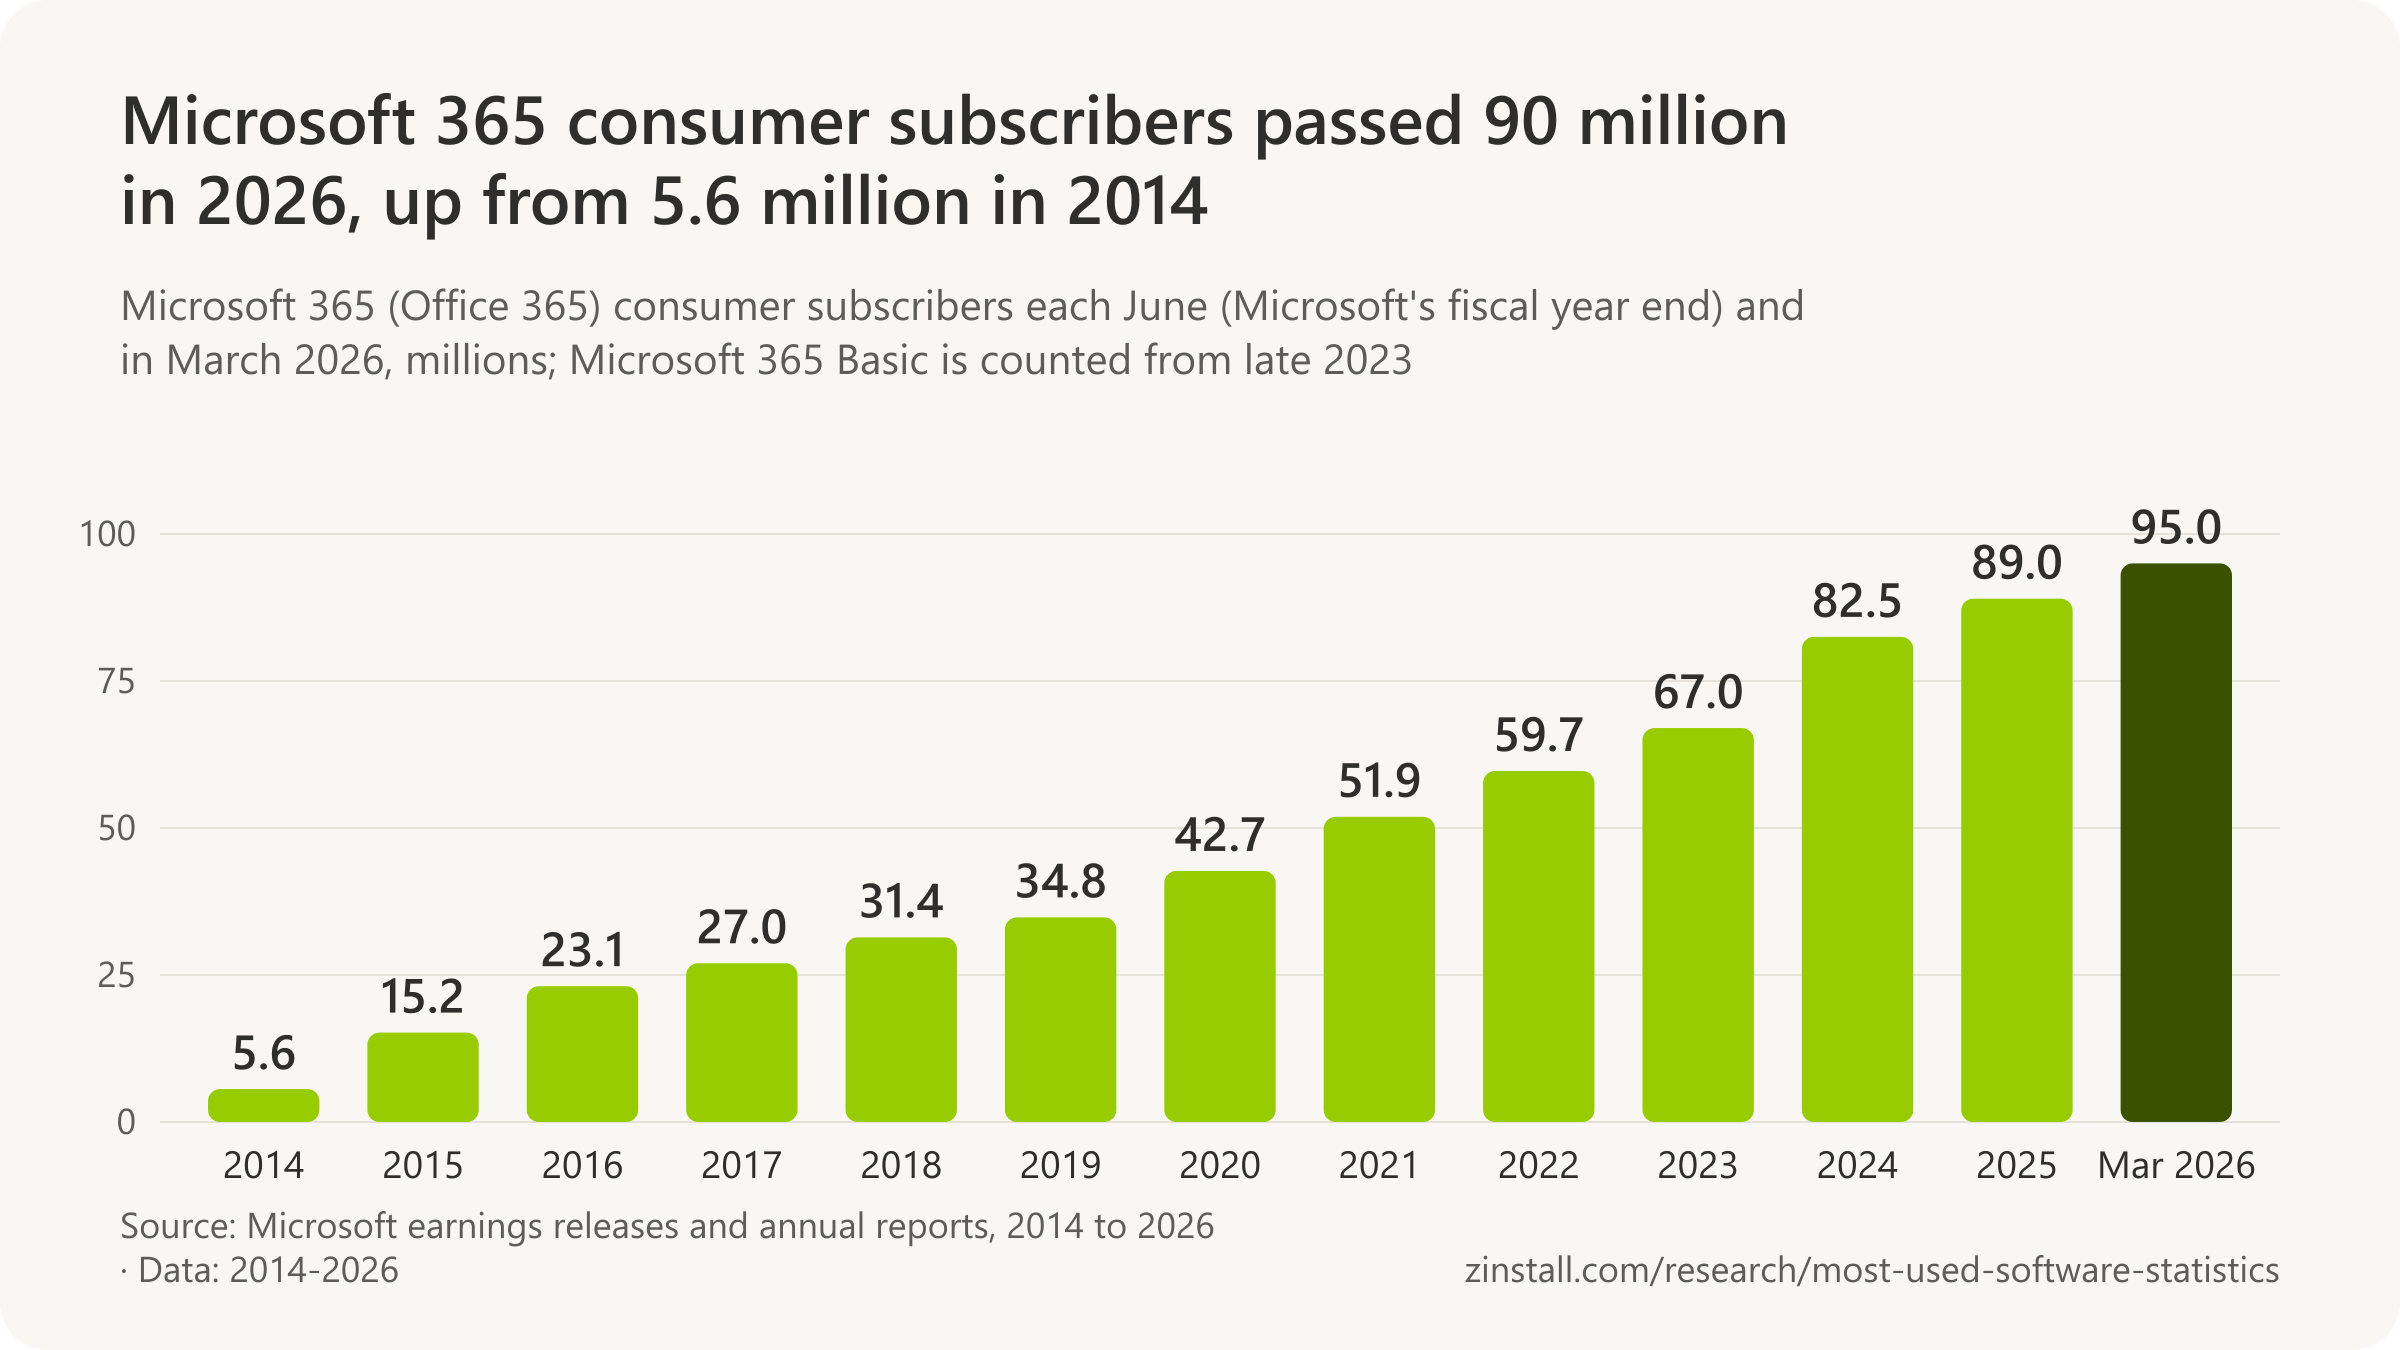
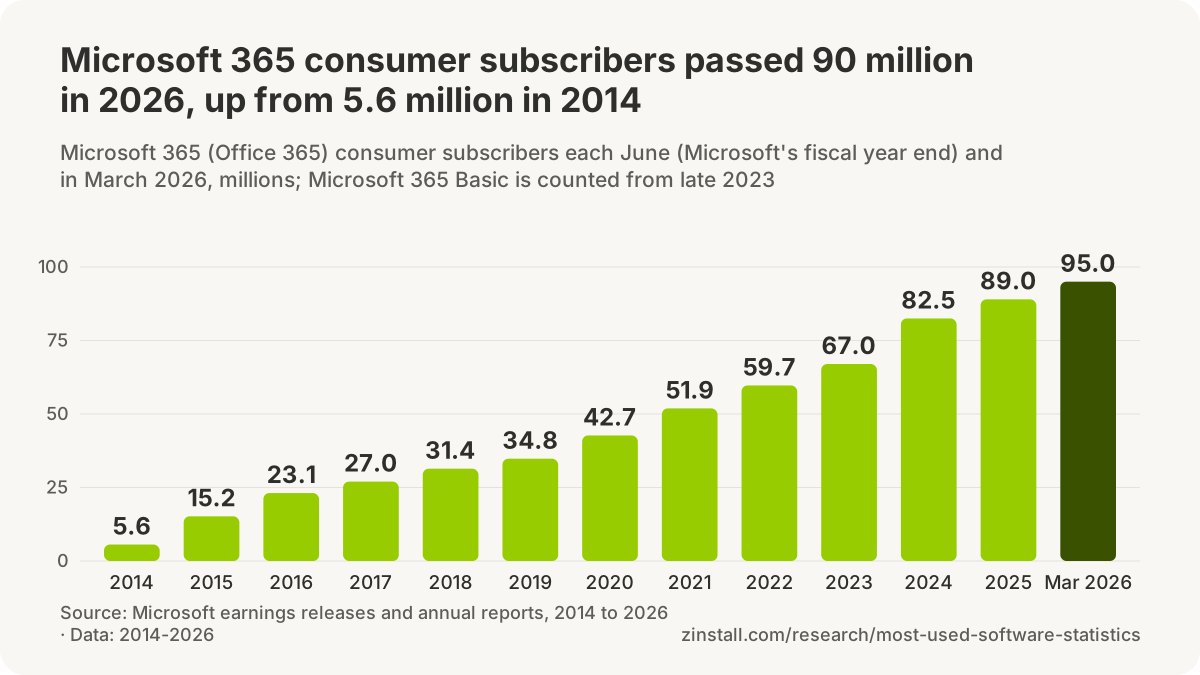
- Microsoft 365 had nearly 95 million consumer subscribers in March 2026.
- Microsoft's last total of people using Office was more than 1.2 billion, first given in 2015.
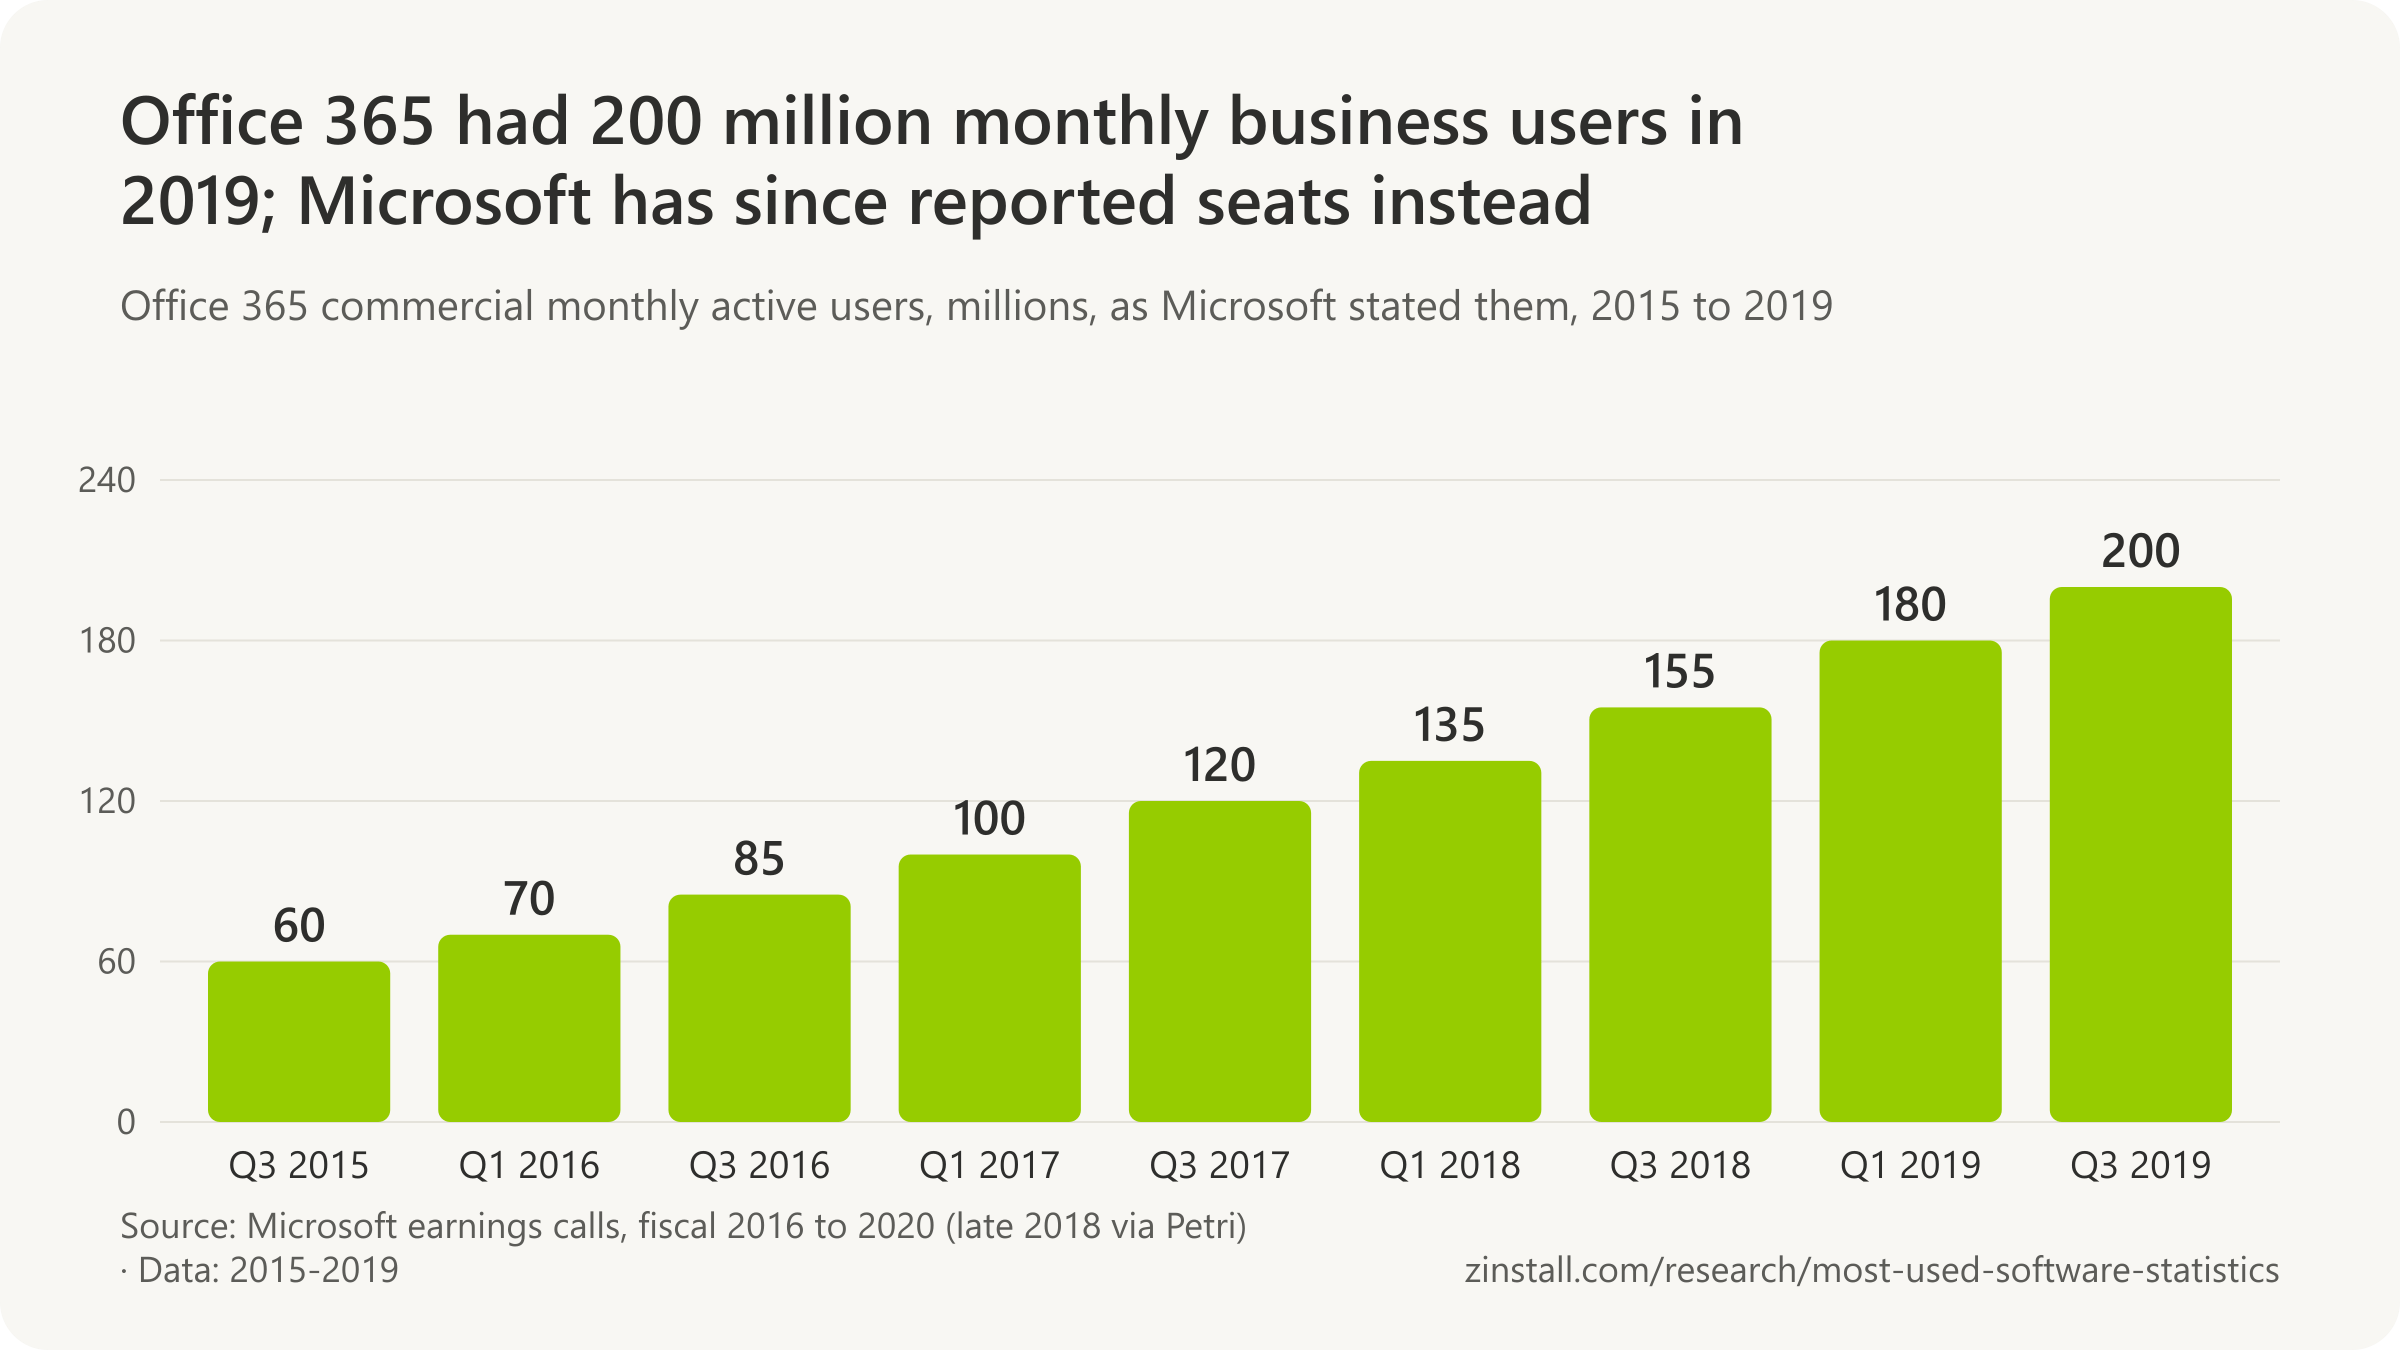
- Office 365 had more than 200 million monthly business users in September 2019, before Microsoft switched to counting seats.
- 82% of organisations still used a one-time-purchase version of Office in 2017, and 53% used Office 365.
- About 7% of Microsoft 365 business seats carried a paid Copilot seat by mid-2026.
| Measure and date | Count |
|---|---|
| People using Office, July 2012 | 1 billion |
| Consumer subscribers, March 2014 | 4.4 million |
| Office 365 business monthly users, September 2015 | 60 million |
| Office mobile app downloads, 2016 | 340 million |
| iPhones, iPads and Android devices using Office each month, 2016 | more than 50 million |
| Paid business seats, March 2020 | nearly 258 million |
| Consumer subscribers, June 2025 | 89.0 million |
| Growth in paid business seats, year to June 2026 | 6% |
Sources: Microsoft (2012-2026); Spiceworks; GeekWire
Moving these programs to a new computer: Microsoft Office · Microsoft 365 · Outlook
More statistics (7)
Microsoft stopped giving a number of people using Office after 2018. It now reports paid commercial seats (licences held by businesses, schools and governments) and consumer subscribers, both on its earnings calls. A seat is a licence, not a person: one person can hold several, and some go unused.
Business seats
- 6% year-over-year growth in paid Microsoft 365 commercial seats in the quarter to June 2026, the latest seat disclosure, Microsoft said on its July 2026 earnings call without giving a new total (Microsoft, 2026).
Consumer subscribers

Business monthly active users, 2015 to 2019

'More than a billion people use Office'
- 1 billion people worldwide use Microsoft Office, Microsoft's Office Division president Kurt DelBene announced at the July 2012 Worldwide Partner Conference (Microsoft, 2012).
- More than 1.2 billion people use Microsoft Office, Microsoft said on its 'By the Numbers' fact page from at least October 2015, a figure it repeated until 2018 (Microsoft, 2015).
- 340 million downloads of Microsoft Office on iPhones, iPads and Android devices by early 2016, Microsoft said on its 'By the Numbers' page, downloads rather than users (Microsoft, 2016).
- More than 50 million iOS and Android monthly active devices ran Office in 2016, up more than four times in a year, Microsoft said in its fiscal 2016 annual report (Microsoft, 2016).
Numbers in circulation
- Petri reported from Build 2016 that there were 1.2 billion Office users, 'all Office users, not just Office 365', with 340 million mobile app downloads, restating Microsoft's claim (Petri, 2016).
- Countly's July 2026 roundup put Microsoft 365 at about 450 million paid subscribers, 400 million commercial seats and 50 million consumers, figures that do not match Microsoft's own disclosures (Countly, 2026).
Sources: Microsoft (2012-2026); Petri IT Knowledgebase (2016, 2018); Countly
How many people still use Office 2016, 2019 or 2021?

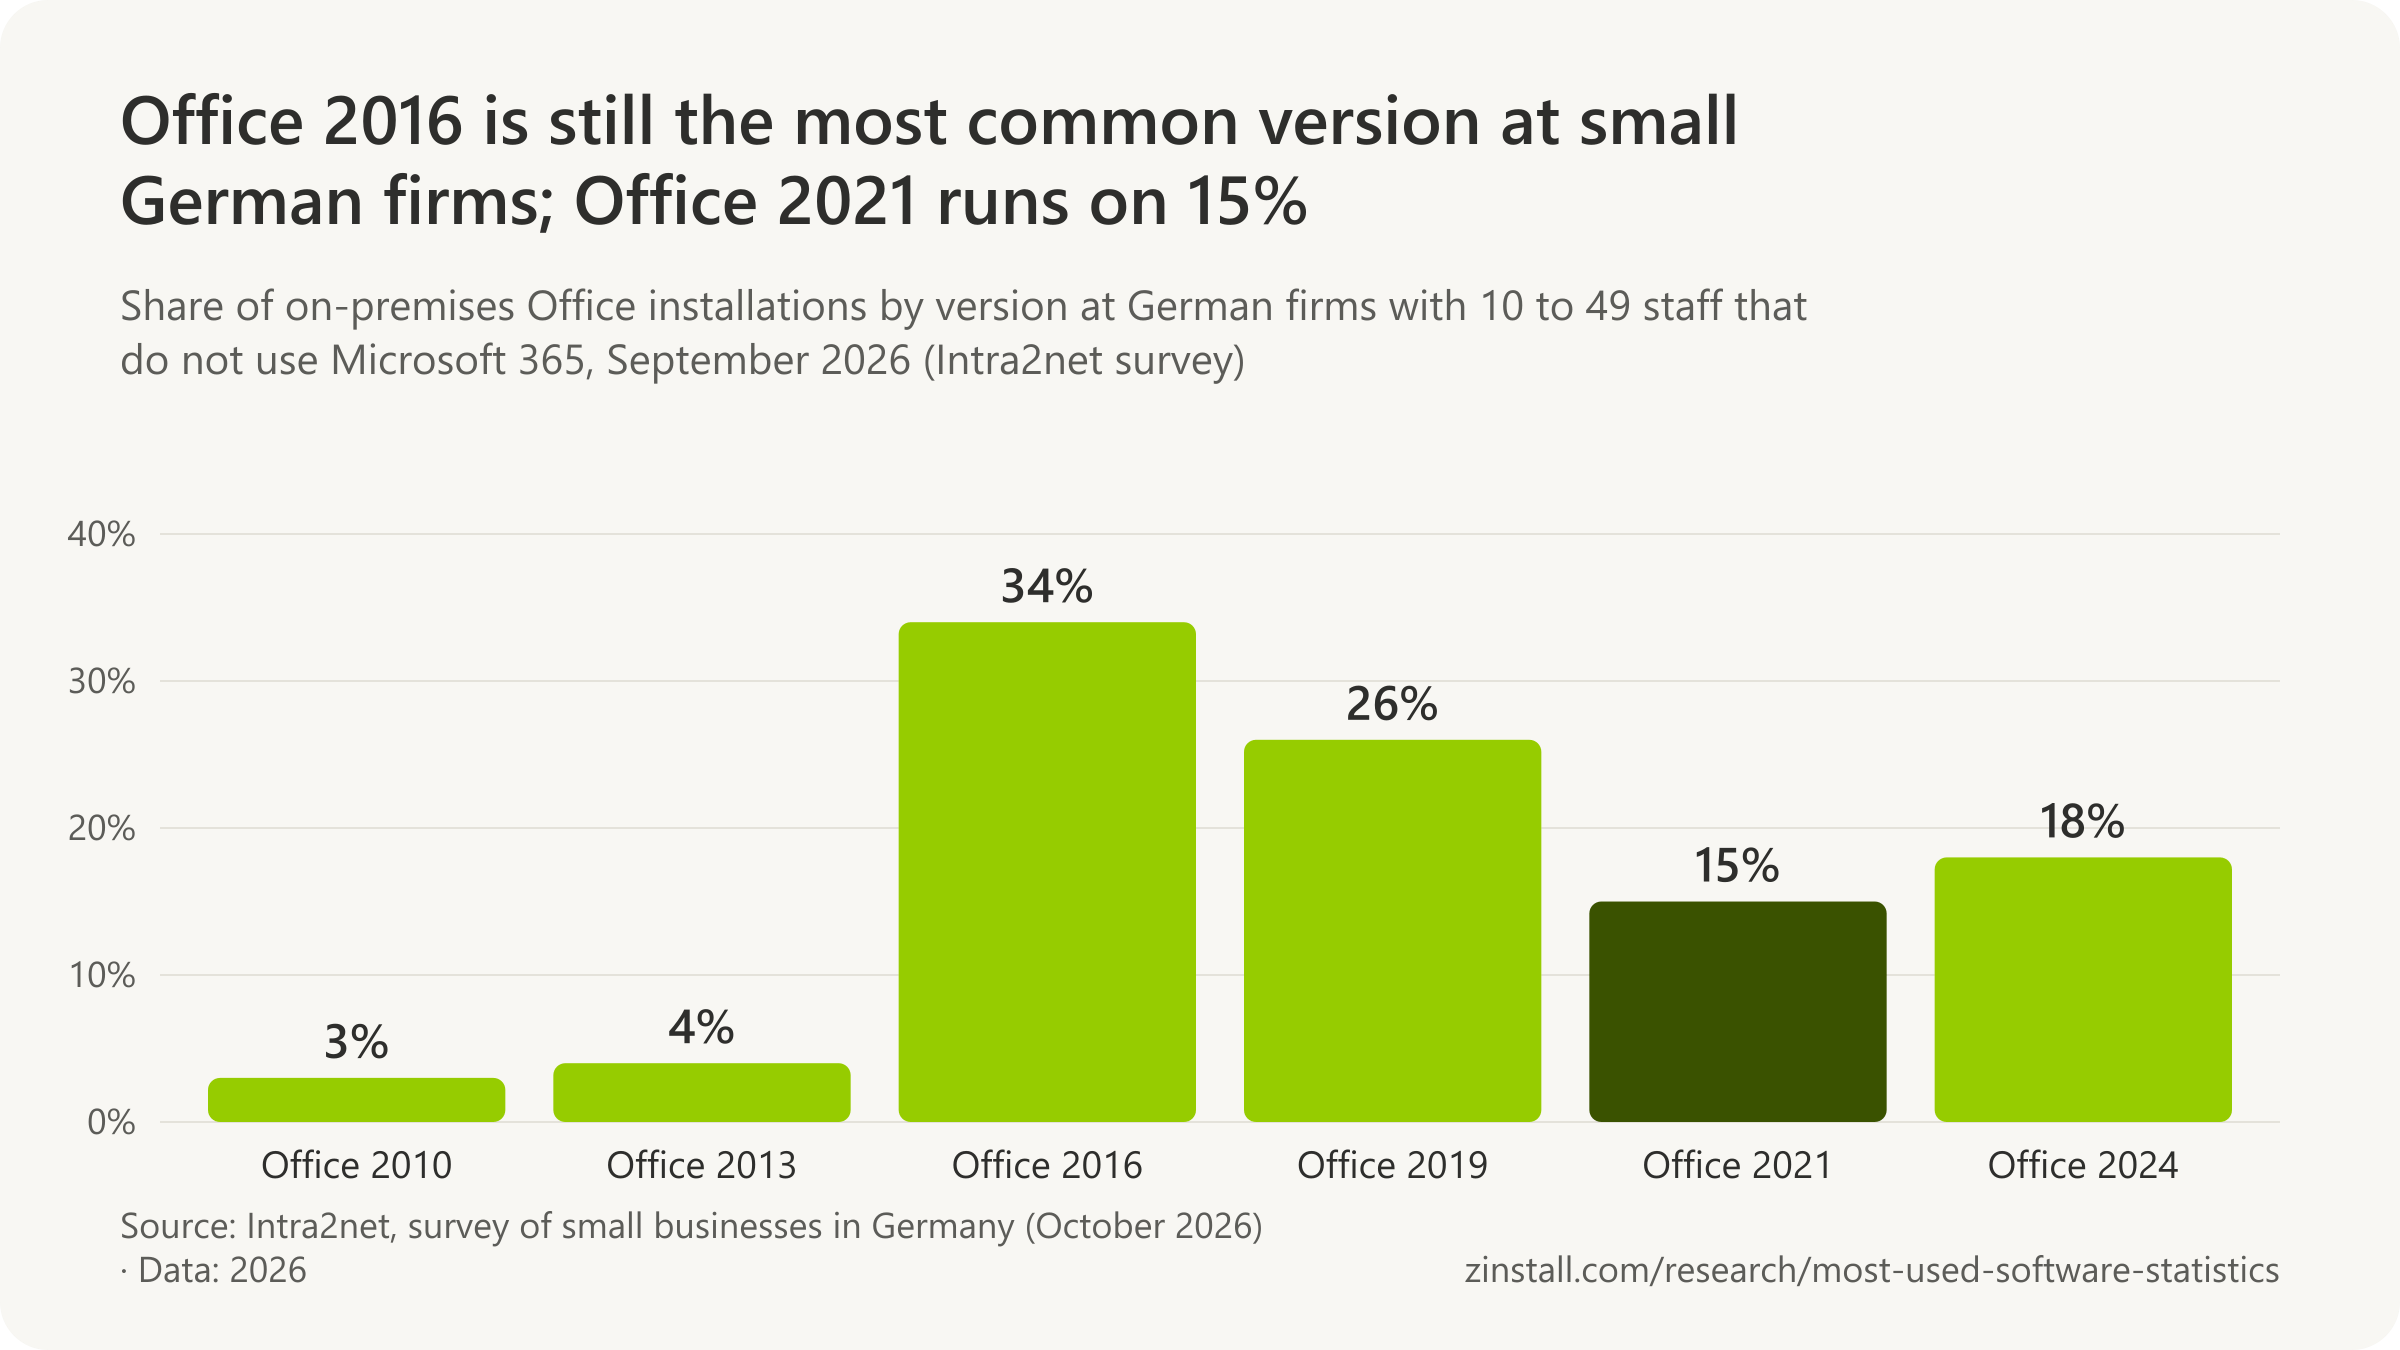
- After 13 October 2026, 82% of the on-premises Office PCs at small German firms ran an Office version without security updates.
- Only one in ten small German firms with on-premises Office updated it in the year to September 2026.
- Microsoft and the trackers publish no count of Office 2021 users.
- Office 2016 and 2019 lost support on 14 October 2025, the day Windows 10 support ended.
| Version | End of support |
|---|---|
| Office 2010 | 13 October 2020 |
| Office 2013 | 11 April 2023 |
| Office 2016 | 14 October 2025 |
| Office 2019 | 14 October 2025 |
| Office 2021 | 13 October 2026 |
| Office LTSC 2021 | 13 October 2026 |
| Office 2024 | 9 October 2029 |
| Office LTSC 2024 | 9 October 2029 |
| Office 2019 for Mac | 10 October 2023 |
| Microsoft 365 Apps (subscription) | no end date |
Sources: Intra2net AG (2026a, 2026b, 2026c); Microsoft (2022-2026)
Moving these programs to a new computer: Office 2016 · Office 2019 · Microsoft Office
More statistics (140)
Microsoft publishes no count of people or PCs on any Office version, and no tracker measures the versions in use worldwide. The one regular sample is Intra2net's yearly survey of small German firms that do not use Microsoft 365, which covers the one-time-purchase versions only. Older counts come from IT-management networks and security scans.
Intra2net: Office versions at small German firms

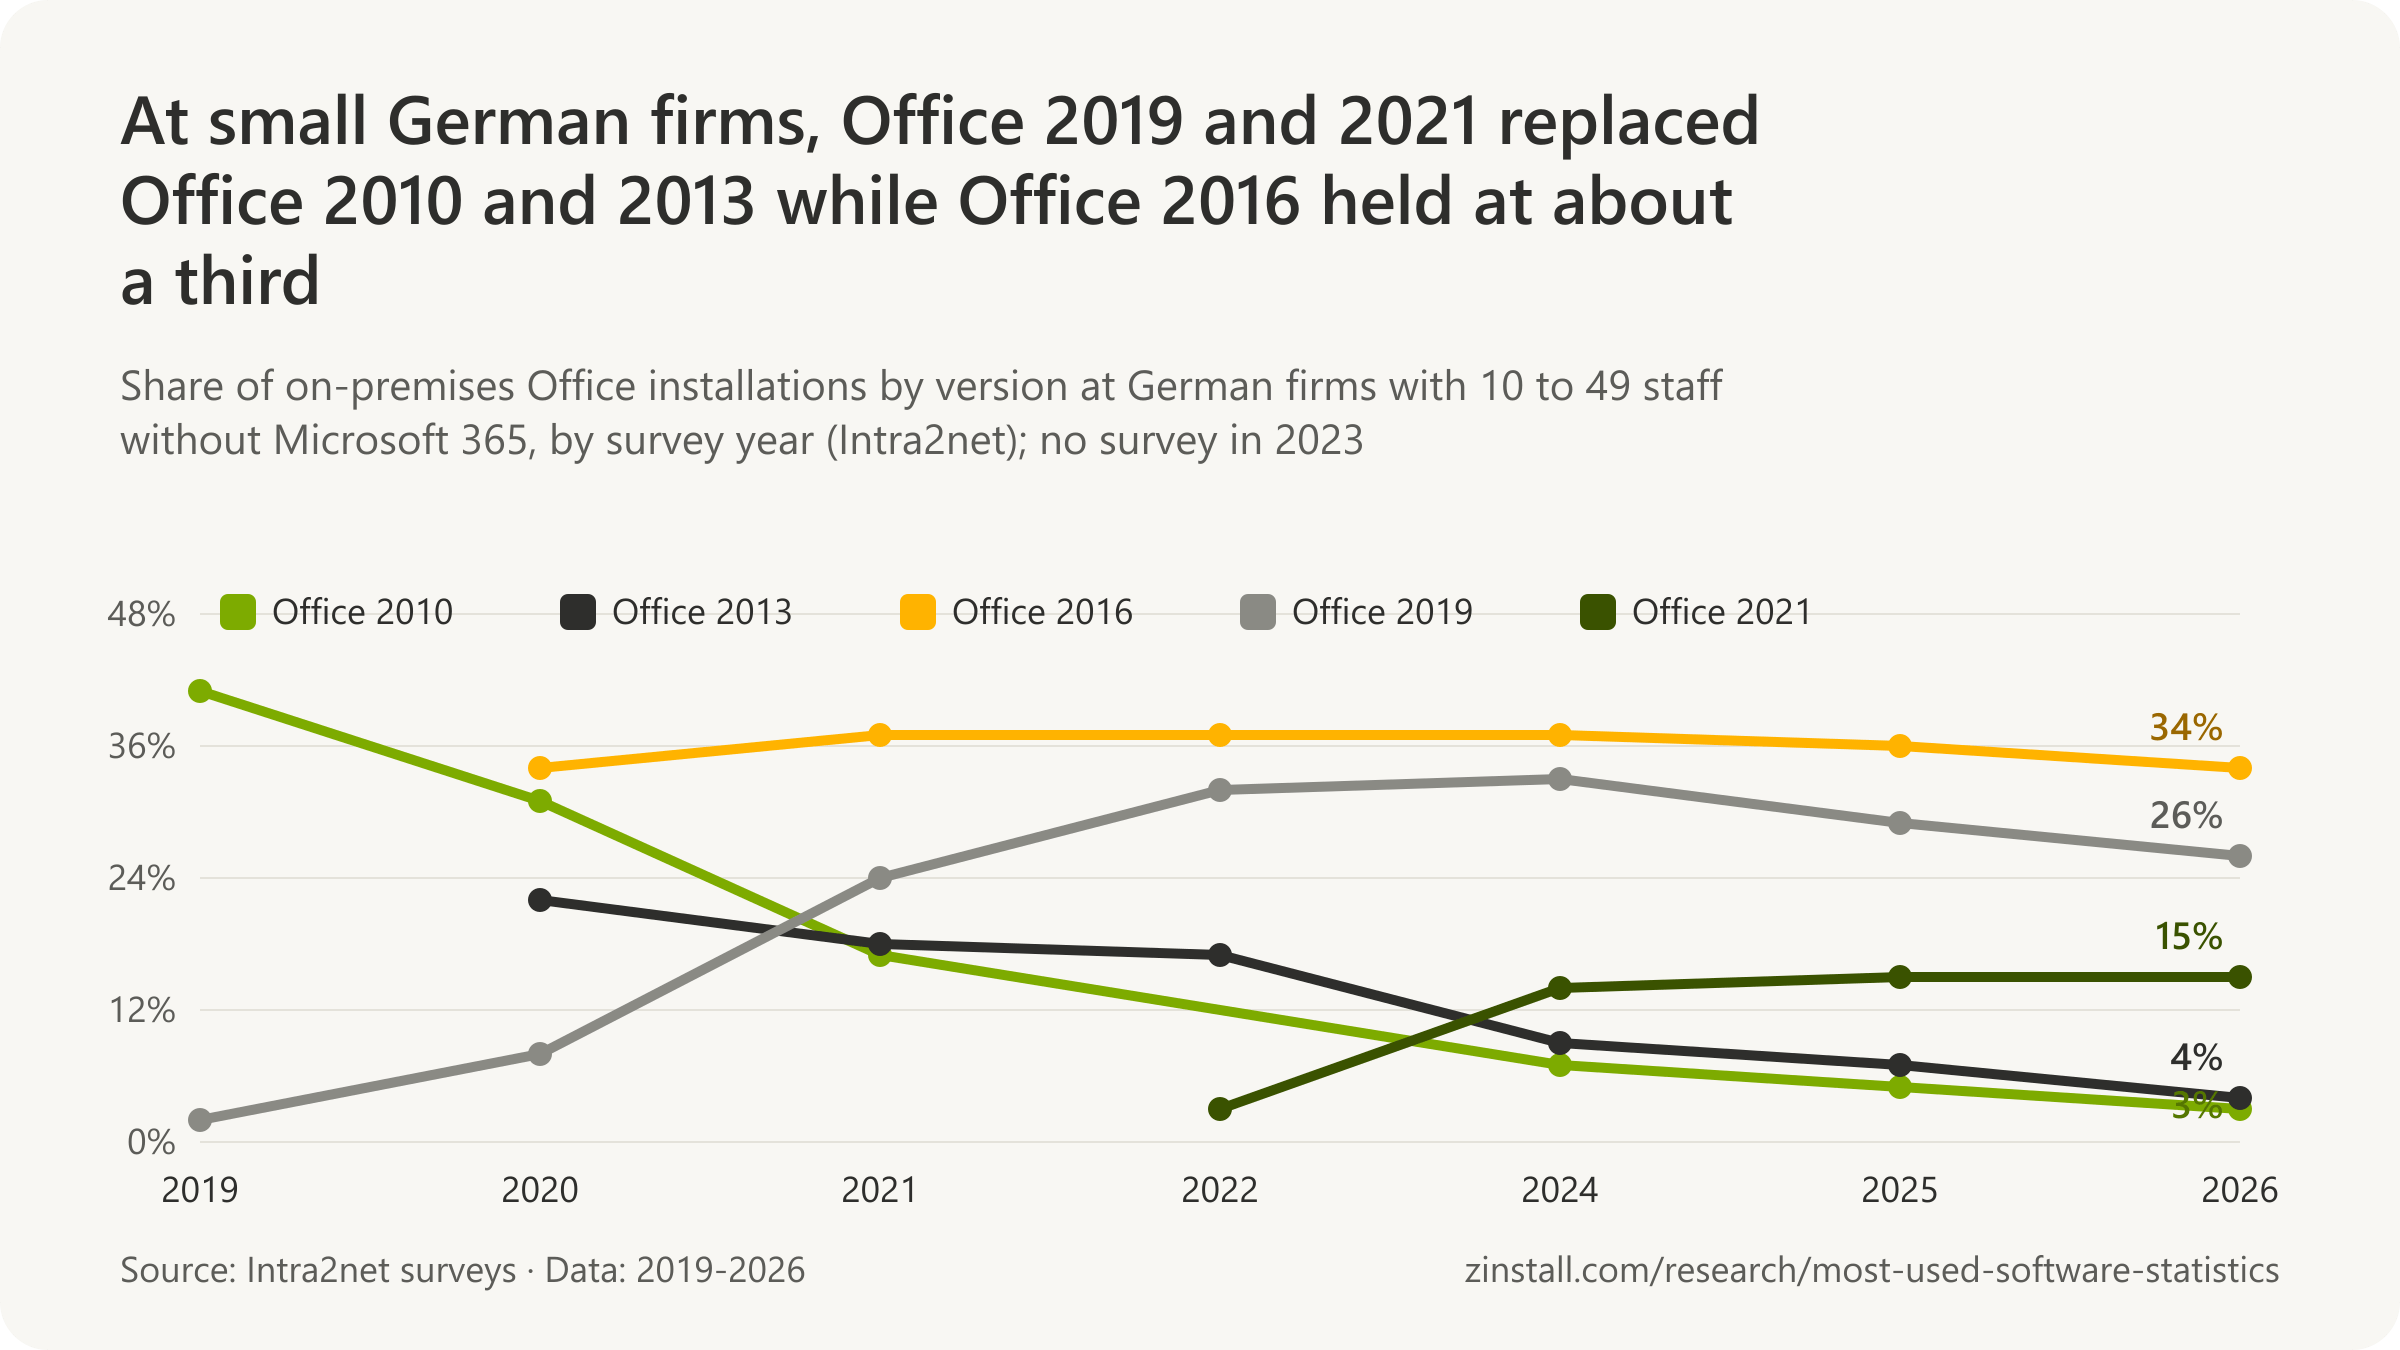
| Version and survey date | Share of PCs |
|---|---|
| Office 2021, September 2026 | 15% |
| Office 2016, September 2026 | 34% |
| Office 2019, September 2026 | 26% |
| Office 2024, September 2026 | 18% |
| Office 2013, September 2026 | 4% |
| Office 2010, September 2026 | 3% |
| Office 2021, September 2025 | 15% |
| Office 2016, September 2025 | 36% |
| Office 2019, September 2025 | 29% |
| Office 2024, September 2025 | 8% |
| Office 2013, September 2025 | 7% |
| Office 2010, September 2025 | 5% |
| Office 2021, September 2024 | 14% |
| Office 2016, September 2024 | 37% |
| Office 2019, September 2024 | 33% |
| Office 2013, September 2024 | 9% |
| Office 2010, September 2024 | 7% |
| Office 2021, September 2022 | 3% |
| Office 2019, September 2022 | 32% |
| Office 2016, September 2022 | 37% |
| Office 2013, September 2022 | 17% |
| Office 2010 and 2007, September 2022 | 11% |
| Office 2010, March 2021 | 17% |
| Office 2007, March 2021 | 4% |
| Office 2019, March 2021 | 24% |
| Office 2016, March 2021 | 37% |
| Office 2013, March 2021 | 18% |
| Office 2010, Q1 2020 | 31% |
| Office 2007, Q1 2020 | 5% |
| Office 2016, Q1 2020 | 34% |
| Office 2013, Q1 2020 | 22% |
| Office 2019, Q1 2020 | 8% |
| Office 2010, Q1 2019 | 41% |
| Office 2019, Q1 2019 | 2% |
- 82% of the on-premises Office installations at small German businesses without Microsoft 365 no longer get security updates now that Office 2021 support ended on 13 October 2026, Intra2net's September 2026 survey found (Intra2net, 2026).
- One in ten small German businesses (10%) updated its on-premises Office suite in the twelve months to September 2026, despite the October 2025 end of support for Office 2016 and 2019, Intra2net found (Intra2net, 2026).
- 77% of the on-premises Office installations at small German businesses without Microsoft 365 lost security updates when Office 2016 and 2019 support ended on 14 October 2025, Intra2net's September 2025 survey found (Intra2net, 2025).
- More than 80% of the on-premises Office installations at small German businesses were on versions that would be out of support by October 2025, Intra2net's September 2024 survey found (Intra2net, 2024).
- 28% of the on-premises Office installations at small German businesses were on versions out of support or due to lose it within months (Office 2007, 2010 and 2013) in September 2022, Intra2net found (Intra2net, 2022).
- 21% of the PCs with on-premises Microsoft Office at small German businesses ran versions without security updates (Office 2010 or 2007) in March 2021, five months after Office 2010's end of support (Intra2net, 2021).
- 36% of the on-premises Office installations at small German businesses were on Office 2010 (31%) or the already unsupported Office 2007 (5%) ahead of Office 2010's end of support in October 2020, which Intra2net called an urgent need to act in April 2020 (Intra2net, 2020).
Earlier counts: Spiceworks, Smart Profile, Avast and Exo
- 83% of organisations in Spiceworks' deployment data ran Office 2010 somewhere on their networks in 2017, the most widely deployed version, against 46% for Office 2013 and 17% for Office 2016 (Spiceworks, 2017).
- 46% of organisations in Spiceworks' deployment data ran Office 2013 somewhere on their networks in 2017 (Spiceworks, 2017).
- 17% of organisations in Spiceworks' deployment data ran Office 2016 somewhere on their networks in 2017, two years after its release (Spiceworks, 2017).
- 68% of organisations in Spiceworks' deployment data still ran Office 2007 somewhere on their networks in autumn 2017, as its support ended on 10 October 2017 (Spiceworks, 2017).
- 46% of organisations in Spiceworks' deployment data still ran at least one copy of Office 2003 in 2017, three and a half years after its end of support, with Office 2000 at 21% and Office XP at 15% (Spiceworks, 2017).
- 82% of organisations used an on-premises (one-time purchase) version of Microsoft Office in September 2017, while 53% also used the Office 365 subscription, in Spiceworks' survey of 1,168 IT professionals in the US, Canada and the UK (Spiceworks, 2017).
- 38% of Dutch business sites with 50 or more employees still used Office 2010 in 2017, seven years after its release and down from more than half in 2016, Smart Profile found (Smart Profile, 2017).
- 29% of Dutch business sites with 50 or more employees used Office 2013 in 2017, as many as used the Office 365 subscription, Smart Profile found (Smart Profile, 2017).
- About 29% of Dutch business sites with 50 or more employees used the Office 365 subscription in 2017, against 38% still on Office 2010, Smart Profile found (Smart Profile, 2017).
- Nearly one in seven (about 14%) Dutch business sites with 50 or more employees used Office 2016 in 2017, two years after its release, ranging from about 16% at sites with 50 to 100 staff to 5% at sites with over 1,000 (Smart Profile, 2017).
- 15% of users worldwide still had the Enterprise edition of Office 2007 installed in 2018, more than a year after its end of support, in Avast's PC Trends Report 2019 drawn from 163 million devices running Avast and AVG software (Avast, 2019).
- Nearly 35% of Windows PCs ran some variant of Office 2007 in September 2009, in the exo.performance.network sample of about 10,000 monitored PCs reported by InfoWorld (InfoWorld, 2009).
Why no source counts Office 2021 users
- Microsoft pushed a one-time update (KB5021751) in January 2023 to count users of Office 2007, 2010 and 2013 and other out-of-support versions, but has never published the result, so no Microsoft count of old-Office users exists (Microsoft, 2023).
- No count of how many people use Office 2021 or Office LTSC 2021 has been published by Microsoft or any tracker; the closest labelled sample, Intra2net's, found Office 2021 on 15% of on-premises Office PCs at small German firms in September 2026 (Intra2net, 2026).
- No count of how many people still use Office 2016 or Office 2019 has been published since their October 2025 end of support; the closest labelled sample, Intra2net's, found them on 60% of on-premises Office PCs at small German firms in September 2026 (Intra2net, 2026).
- No count of Office 2024 or Office LTSC 2024 users has been published; Microsoft says only that Office 2024 one-time purchases lifted its on-premises revenue, and Intra2net found Office 2024 on 18% of on-premises Office PCs at small German firms in September 2026 (Intra2net, 2026).
- No count of Office LTSC (volume-licensed perpetual Office) users has been published; Microsoft says only that many customers deploy Office LTSC on a subset of their devices alongside Microsoft 365 Apps (Microsoft, 2024).
- No usage figure for Office 2016, 2019, 2021 or 2024 for Mac has been published by Microsoft or any tracker; the last found is from Forrester's 2013 survey, in which 17% of 155 client companies had Office for Mac 2011 (Forrester via PCWorld, 2013).
- Lansweeper offers customers an Office end-of-life audit of their own networks but has published no aggregate share of Office versions across its customer base, unlike its Windows end-of-life figures (Lansweeper, 2026).
End of support by version
| Version | End of support |
|---|---|
| Office 2003 | 8 April 2014 |
| Office 2007 | 10 October 2017 |
| Office 2010 | 13 October 2020 |
| Office 2013 | 11 April 2023 |
| Office 2016 | 14 October 2025 |
| Office 2019 | 14 October 2025 |
| Office 2021 | 13 October 2026 |
| Office LTSC 2021 | 13 October 2026 |
| Office 2024 | 9 October 2029 |
| Office LTSC 2024 | 9 October 2029 |
| Office for Mac 2011 | 10 October 2017 |
| Office 2016 for Mac | 13 October 2020 |
| Office 2019 for Mac | 10 October 2023 |
| Office LTSC 2021 for Mac | 13 October 2026 |
| Office 2008 for Mac | 9 April 2013 |
| Office 2004 for Mac | 10 January 2012 |
| Microsoft 365 Apps | no end date |
Outlook: classic and new
- 14 October 2025 ended support for Office 2016 and Office 2019 together with Outlook, Project, Visio, Skype for Business and Exchange Server 2016 and 2019 and the single Office apps, on the same day as Windows 10 (Microsoft Lifecycle, 2024).
- Until at least 2029 Microsoft will honour the published support timelines of existing classic Outlook for Windows installations, perpetual and subscription, it said when setting out the new Outlook's opt-in, opt-out and cutover stages (Microsoft, 2024).
- 1 August 2024 was when the new Outlook for Windows became generally available for business customers, still as an opt-in app, after reaching personal accounts in September 2023 (Microsoft, 2024).
- Tens of millions of people use the new Outlook for Windows across work and personal accounts, Microsoft said when the app became generally available to businesses in August 2024, its only published indication of the new app's user base (Microsoft, 2024).
- January 2025 for small businesses and 2026 for enterprise customers were the dates Microsoft gave at Ignite 2024 for moving the new Outlook from opt-in to the opt-out phase, in which it becomes the default (Microsoft, 2024).
- March 2027 is when the new Outlook for Windows becomes the default (the opt-out phase) for enterprise customers, Microsoft told administrators in February 2026, postponing the April 2026 date it had set in December 2024 (Microsoft, 2026).
- Users on a perpetual Office licence will not be migrated to the new Outlook when the enterprise opt-out phase starts in March 2027, nor will on-premises accounts or users whose admins hide the toggle, Microsoft's Message Center notice says (Microsoft, 2026).
- 31 December 2024 was the end of support for the Windows Mail, Calendar and People apps, which Microsoft replaced with the new Outlook for Windows (Microsoft Support, 2026).
- A mid-single-digit decline in Microsoft's on-premises commercial Office and Windows revenue is expected for the year to June 2027, as Microsoft laps the one-time purchases that followed product launches (Microsoft, 2026).
What happens when Office support ends
- 10 October 2023 was the date Microsoft stopped supporting connections from Office 2016 and Office 2019 to Microsoft 365 services such as Exchange Online, SharePoint Online and OneDrive, two years before the suites' own end of support (Microsoft, 2026).
- 13 October 2026 was the last day Office LTSC 2021 was supported for connecting to Microsoft 365 services, against 9 October 2029 for Office LTSC 2024 and no end date for Microsoft 365 Apps on a supported version (Microsoft, 2026).
- Office apps must be in mainstream support for their connection to Microsoft 365 cloud services to count as supported, Microsoft's Office and Windows configuration matrix states, which is why Office 2016 and 2019 lost connection support before their 2025 end of support (Microsoft Lifecycle, 2026).
- Office 2016 was supported on Windows 11 only by an exception Microsoft made 'to maximize customer access to Windows 11', since Office 2016 was already in extended support when Windows 11 shipped (Microsoft Lifecycle, 2026).
- Office 2016 and Office 2019 are listed as 'Not supported' on Windows 11 and Windows 10, while Office 2021 and Office 2024 are 'Supported' on Windows 11 and 'Supported (with exceptions)' on Windows 10, in Microsoft's 2026 support table (Microsoft Support, 2026).
- Support for Office 2016 and Office 2019 ended on 14 October 2025 on all operating systems, the day Windows 10 support ended, and support for Office 2021 and Office LTSC 2021 was to end a year later, in October 2026 (Microsoft, 2026).
- Microsoft 365 Apps on Windows 10 keep receiving security updates for three years after Windows 10's end of support, until 10 October 2028 (Microsoft, 2026).
- Microsoft 365 Apps on Windows 10 stop receiving feature updates at Version 2608, the August 2026 build, and then receive only security updates until 10 October 2028 (Microsoft, 2026).
- 14 October 2025 was the end of support for Microsoft 365 Apps on Windows Server 2016 and Windows Server 2019, with security updates continuing until 10 October 2028; on Windows Server 2022 support ended on 13 October 2026 (Microsoft, 2026).
- No extension and no extended security updates are offered for Office 2021, Microsoft's end-of-support page says now that support ended on 13 October 2026, unlike the paid Extended Security Updates it sold for Windows 10 (Microsoft Support, 2026).
- Office 2016 and Office 2019 apps may continue to function after support ended on 14 October 2025, but users could be exposed to security risks and the apps' performance may degrade over time, Microsoft says (Microsoft Support, 2026).
- 5 years of support is the cadence Microsoft now gives on-premises versions of Office such as Office 2024 and Office LTSC 2024, arguing that 'software that is a decade old or more' becomes less productive and harder to secure (Microsoft Support, 2026).
- 9 October 2029 is the end of support for Office 2024 for Mac and Office LTSC for Mac 2024, the same day as their Windows counterparts (Microsoft Support, 2026).
- Office LTSC 2024, the perpetual volume-licensed version, is 'designed for specific scenarios' such as regulated devices that cannot take feature updates, factory process-control machines and systems that cannot connect to the internet, Microsoft tells organisations still on Office 2016, 2019 or LTSC 2021 (Microsoft, 2026).
- 13 October 2026 ended support for Office 2021 and Office LTSC 2021 together with Outlook 2021, Outlook LTSC 2021, Project 2021, Visio 2021 and the single Office 2021 apps, Microsoft's 'Ending Support in 2026' list shows (Microsoft Lifecycle, 2026).
- 7 years of support (5 mainstream, 2 extended) was Microsoft's term for Office 2019, an exception to its usual 10-year Fixed Lifecycle term so that Office 2019 would end with Office 2016 in 2025 (Microsoft Lifecycle, 2018).
- 5 years of mainstream support was the term Microsoft set in February 2021 for Office LTSC, the next perpetual commercial Office, while Office 2021 for consumers and small businesses got 'a minimum of 5 years' under the Modern Lifecycle Policy (Microsoft Lifecycle, 2021).
- Office LTSC 2024 is Microsoft's recommended upgrade only for organisations 'not yet ready to move to the cloud', its 2026 Office LTSC 2021 end-of-support notice says, with Microsoft 365 Apps the default path (Microsoft Lifecycle, 2026).
- October 2023 became the end of supported Office 2016 connections to Office 365 services after Microsoft relaxed, in September 2018, its rule that only Office 365 ProPlus or Office 2019 in mainstream support could connect from 13 October 2020 (Microsoft, 2018).
- No option to extend support beyond 11 April 2023 was offered for Office 2013, Microsoft's lifecycle notice said, the same no-extension policy it applied to Office 2016, 2019 and 2021 (Microsoft Lifecycle, 2021).
- Up to 10% was the price rise Microsoft set for Office LTSC 2024, which it called 'a specialty product' kept 'for use in exceptional circumstances' such as offline factory and medical devices (Microsoft, 2024).
- Another Office LTSC release after Office LTSC 2024 was promised by Microsoft in March 2024, the only public commitment to a future perpetual Office version (Microsoft, 2024).
- No on-premises version of Office can use Microsoft 365 Copilot, Microsoft reminded customers on 14 October 2025, the day Office 2016 and 2019 support ended, steering them to Microsoft 365 or Office LTSC 2024 (Microsoft, 2025).
- No extension and no extended security updates were offered for Office 2016 and 2019, The Register reported a month before their 14 October 2025 end of support, while Exchange and Skype for Business servers got a security-update reprieve for customers who signed up (The Register, 2025).
- Office 2016 and 2019 users were 'out of luck' after 14 October 2025, The Register wrote: unlike Windows 10 there was no paid Extended Security Updates programme, leaving Office LTSC 2024 or a Microsoft 365 subscription (The Register, 2025).
- Office 2016 and Office 2019 keep working after their 14 October 2025 end of support but are 'vulnerable to attacks', BleepingComputer reported, pointing to Office 2024 and Office LTSC 2024, supported until 9 October 2029, as the one-time-purchase replacements (BleepingComputer, 2025).
- 13 October 2026, the end of support for Office 2021 and Office LTSC 2021, was also the last patch day of Windows 10's one-year consumer Extended Security Updates, heise noted, and Microsoft offered no paid extension for Office (heise online, 2026).
- Office 2021 owners had no free upgrade path when support ended on 13 October 2026: Windows Report noted they must buy new Office 2024 licences or move to Microsoft 365 (Windows Report, 2026).
- Office 2016 and 2019 Home and Business installations suddenly lost their activation in September 2026, nearly a year after end of support, in a bug users linked to an optional Microsoft 365 Apps update (KB5002907) that Microsoft then paused, The Register reported (The Register, 2026).
- Microsoft kept releasing security updates almost monthly for Office 2016 and Office 2019 in the year after their October 2025 end of support, Help Net Security's October 2026 Patch Tuesday forecast noted, arguing it was time to truly end them (Help Net Security, 2026).
- 36 distinct security patches were released for MSI installations of Office 2016 between its end of support and July 2026, while the Click-to-Run edition most homes and small businesses have got none, Office Watch counted (Office Watch, 2026).
- September 2026 brought the latest of the monthly updates Microsoft has kept shipping for the MSI edition of Office 2016 since its 14 October 2025 end of support, under a clause reserving updates 'at Microsoft's sole discretion' (Microsoft, 2026).
- 13 July 2026 was the day Office 2019 for Mac began opening documents read-only, unable to edit or save, after a licensing certificate expired; Microsoft says updating or reinstalling cannot fix it, while up-to-date Office 2021 for Mac kept working (Microsoft Support, 2026).
On-premises Office revenue

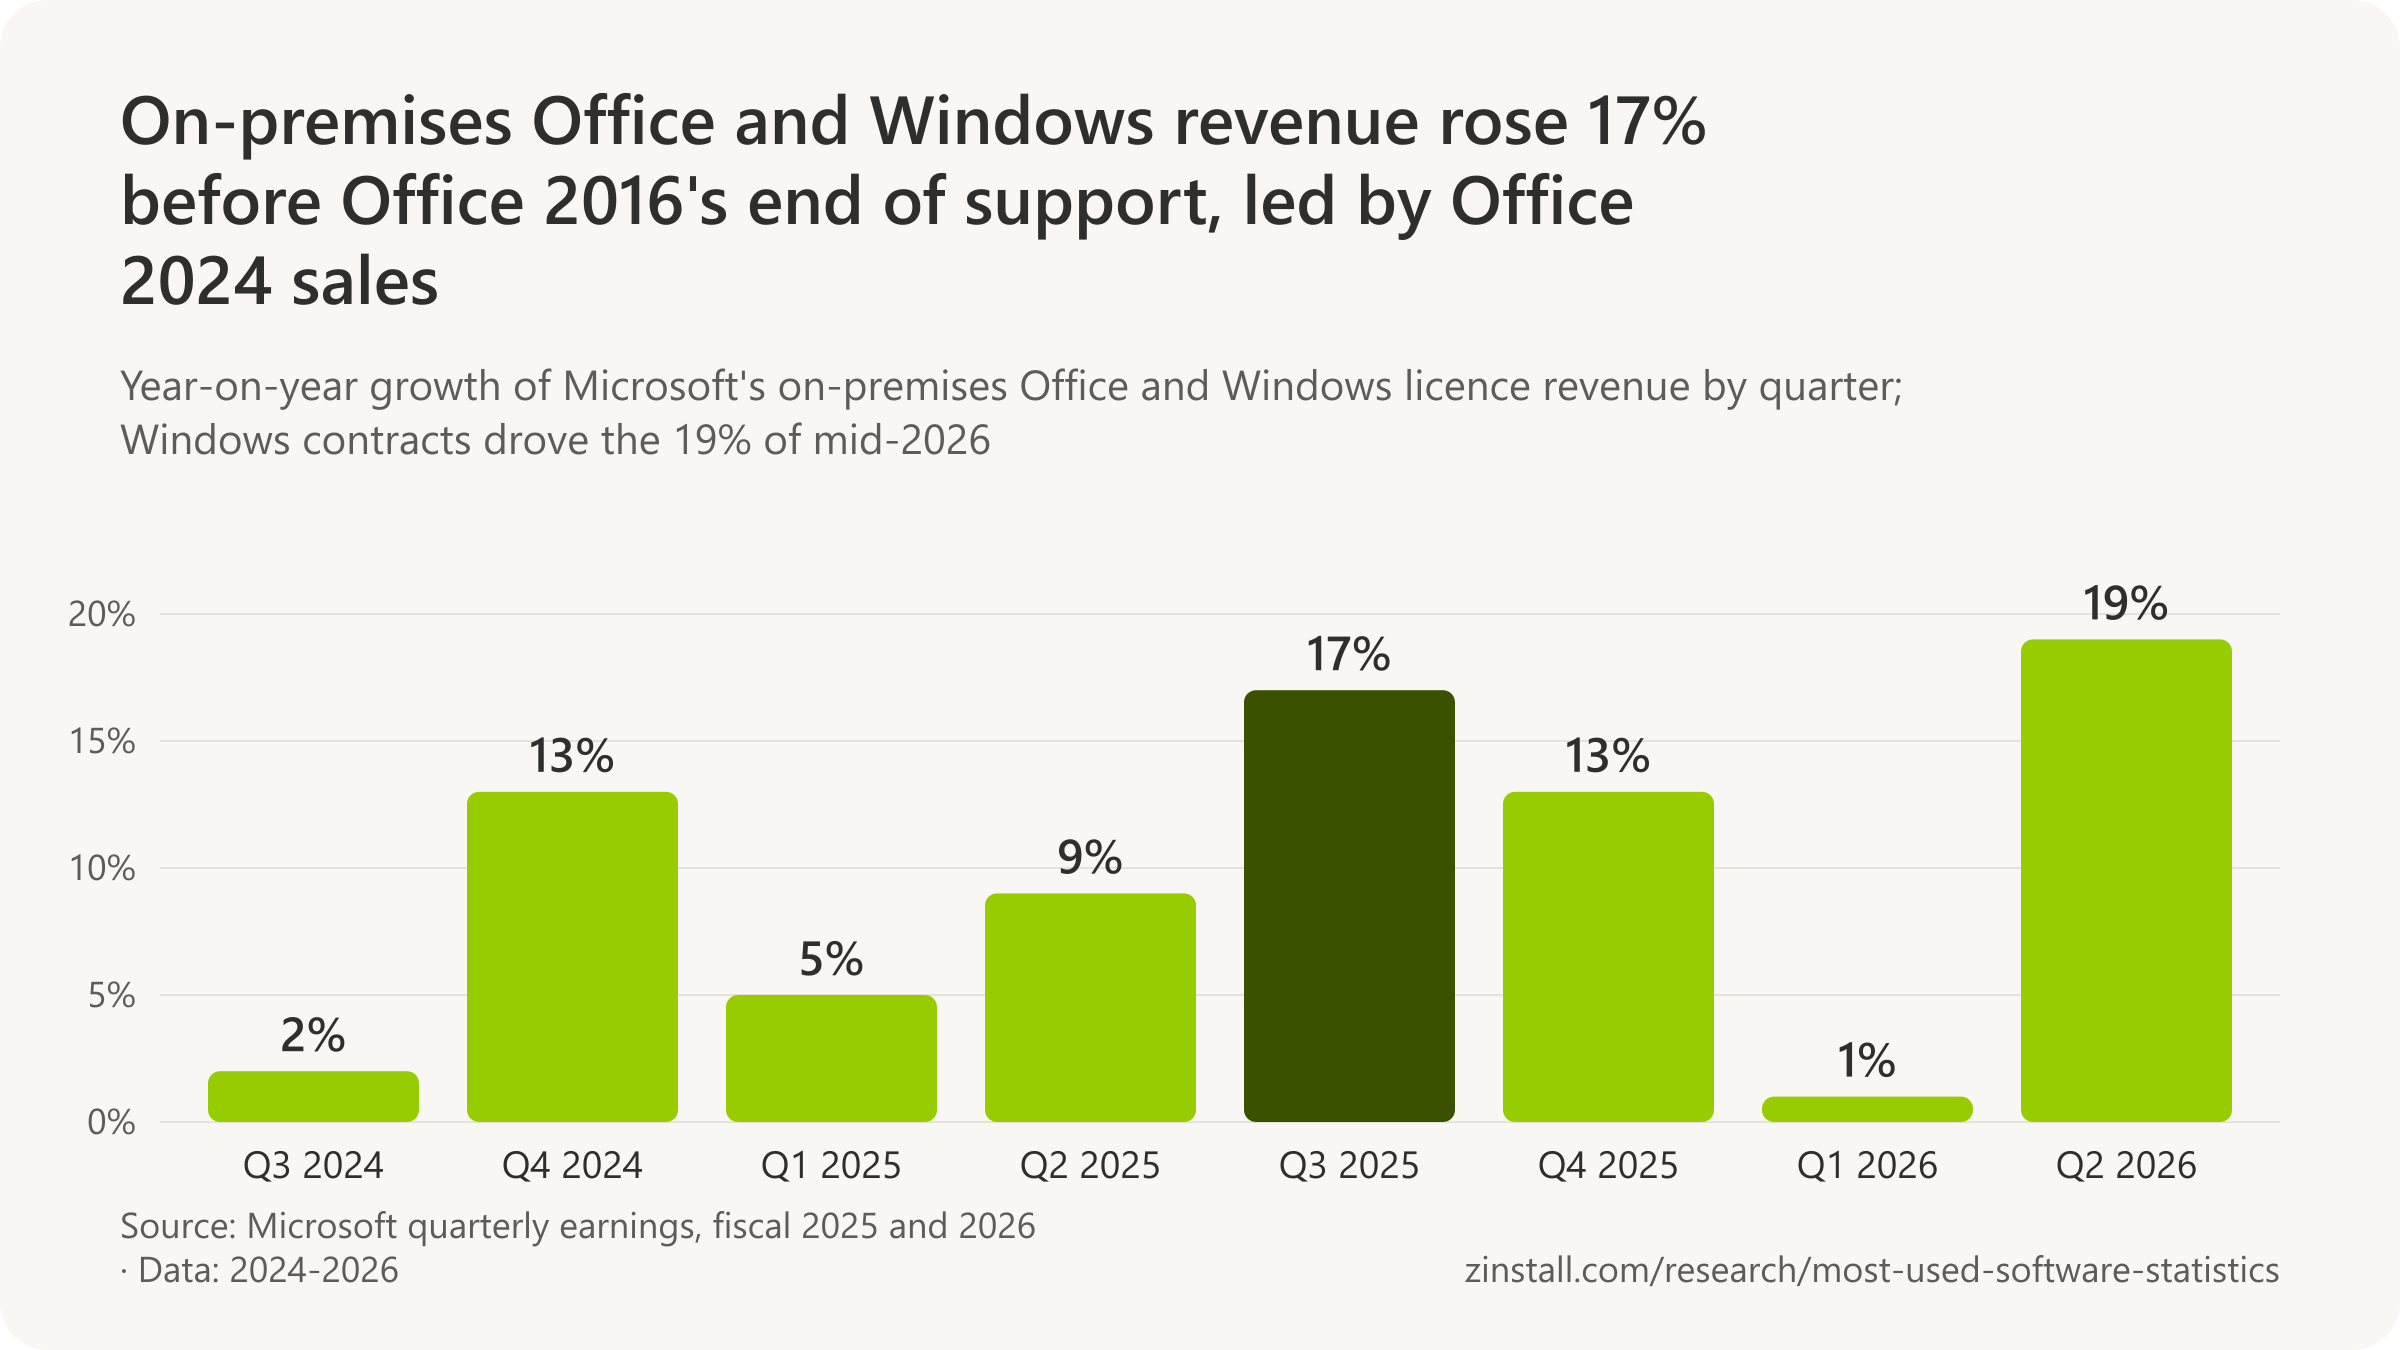
- Office 365 commercial revenue overtook revenue from Microsoft's traditional Office licensing for the first time in the April to June 2017 quarter, CFO Amy Hood said, the tipping point from perpetual to subscription Office in business (Microsoft, 2017).
- 16% was the fall in Microsoft's on-premises commercial Office revenue in the year to June 2024, which Microsoft put down to the continued customer shift to cloud offerings (Microsoft, 2024).
- 7% was the growth in Microsoft's on-premises commercial Windows and Office revenue in the year to June 2025, helped by more one-time Office purchases after Office 2024's launch (Microsoft, 2025).
- 13% was the growth in Microsoft's on-premises commercial Windows and Office revenue in the year to June 2026, which spanned the Office 2016 and 2019 end of support, helped by more Office 2024 one-time purchases (Microsoft, 2026).
- The continued shift from one-time-purchase Office to Microsoft 365 Consumer subscriptions is one of the two main drivers of Microsoft's consumer Office revenue, its 2026 annual report says, without a split between perpetual and subscription users (Microsoft, 2026).
- 2% was the growth in Microsoft's on-premises commercial Office and Windows revenue in July to September 2024, held back by the continued shift from on-premises Office to the Microsoft 365 cloud, Microsoft said (Microsoft, 2024).
- 13% was the growth in Microsoft's on-premises commercial Office and Windows revenue in October to December 2024, which Microsoft credited partly to more one-time purchases with the launch of Office 2024 (Microsoft, 2025).
- 5% was the growth in Microsoft's on-premises commercial Office and Windows revenue in January to March 2025, which Microsoft credited partly to more one-time Office purchases (Microsoft, 2025).
- 9% was the growth in Microsoft's on-premises commercial Office and Windows revenue in April to June 2025, ahead of Microsoft's expectations because of higher-than-expected Office 2024 one-time purchases (Microsoft, 2025).
- 17% was the growth in Microsoft's on-premises commercial Office and Windows revenue in July to September 2025, the quarter before Office 2016 and 2019 lost support, driven first by more Office 2024 one-time purchases, Microsoft said (Microsoft, 2025).
- 13% was the growth in Microsoft's on-premises commercial Office and Windows revenue in October to December 2025, which Microsoft credited partly to more Office 2024 one-time purchases (Microsoft, 2026).
- 1% was the growth in Microsoft's on-premises commercial Office and Windows revenue in January to March 2026, a quarter for which Microsoft named no driver (Microsoft, 2026).
- 19% was the growth in Microsoft's on-premises commercial Office and Windows revenue in April to June 2026, driven by long-duration contracts for the Windows on-premises component rather than by Office, Microsoft said (Microsoft, 2026).
Numbers in circulation
- 83% of enterprises 'use a version of Microsoft Office', TechRepublic wrote in November 2017, restating Spiceworks' finding that 83% of organisations ran Office 2010 somewhere on their networks (TechRepublic, 2017).
- 83% of IT pros' organisations used Office 2010, 68% Office 2007 and 46% Office 2003 'per that survey', Virtualization Review reported in 2017, attributing Spiceworks' network-inventory figures to its survey of 1,168 IT pros in the US and Canada (Virtualization Review, 2017).
- 77% of small German businesses would no longer receive security updates for their Office suite after 14 October 2025, heise reported the same day from Intra2net's SME study (heise online, 2025).
- 77% of small German firms still ran old Office packages against '89 percent' a year earlier, Computerwoche reported from Intra2net's study, although Intra2net's own 2024 figures add up to 86% for the same versions (Computerwoche, 2025).
- 65% was the installation rate of Office 2016 and 2019 as 'the dominant on-premises packages' in October 2025, heise recalled in April 2026, a figure from Intra2net's survey of small German firms without Microsoft 365 (heise online, 2026).
- 80% of smaller German companies used Office packages needing an update in 2025, Computerwoche reported in November 2024, rounding down Intra2net's 'more than 80%' (Computerwoche, 2024).
- More than 620 companies use Microsoft Office 2016, a market share under 0.01%, the technographics vendor Datanyze claimed in October 2024, a web-detection count with no published method that says nothing about how many people use Office 2016 (Datanyze, 2024).
- 673 'verified companies' use Microsoft Office 2016, the technographics vendor Landbase claims on a page titled for 2026 but last updated in August 2025, with no published method (Landbase, 2025).
Sources: Intra2net AG (2020-2026); Spiceworks; Smart Profile; Avast Software; InfoWorld; Microsoft (2017-2026); PCWorld; Lansweeper; The Register (2025, 2026); BleepingComputer; heise online (2025, 2026); Windows Report; Help Net Security; Office Watch; TechRepublic; Virtualization Review; Computerwoche (2024, 2025); Datanyze; Landbase
Are there more Office or OpenOffice users?
Apache OpenOffice was downloaded 11.6 million times in 2025, down from 54.0 million in 2013; it publishes no count of users (Apache OpenOffice, 2026).

- LibreOffice estimates its users at around 100 million, half the figure it gave in January 2025.
- LibreOffice was downloaded 44.8 million times in 2025, its highest year.
- WPS Office counted 676 million monthly active devices worldwide in June 2026.
- Google Workspace has more than 13 million customers; its 3 billion users include free Google accounts.
- 51% of the Microsoft 365 business customers in Okta's network also used Google Workspace.
| Suite, measure and date | Count |
|---|---|
| Apache OpenOffice: downloads since May 2012 | 404.8 million |
| LibreOffice: downloads, October 2025 to September 2026 | 51.2 million |
| WPS Office: paying individual subscribers, June 2026 | 48.25 million |
| Google Workspace: paying customers, April 2025 | over 11 million |
| OnlyOffice: users, 2026 | more than 21 million |
| Zoho Workplace: customers, 2026 | over 450,000 |
| Apple iWork: users, 2013 | over 10 million |
| WordPerfect Office: customers, 2005 | more than 20 million |
Sources: Apache OpenOffice; The Document Foundation (2026a, 2026b); Kingsoft Corporation; Google (2026, 2025); Okta; Ascensio System SIA; Zoho Corporation; Apple; Computerworld
More statistics (57)
No source counts Office and its alternatives in the same measure. Apache OpenOffice and LibreOffice publish downloads; The Document Foundation also estimates LibreOffice's users; Kingsoft counts monthly active devices for WPS Office; Google counts Workspace customers and, including free accounts, users.
Apache OpenOffice
| Year | Downloads |
|---|---|
| 2013 | 54.0 million |
| 2014 | 46.5 million |
| 2015 | 38.3 million |
| 2016 | 38.4 million |
| 2017 | 30.7 million |
| 2018 | 24.6 million |
| 2019 | 19.1 million |
| 2020 | 21.8 million |
| 2021 | 18.5 million |
| 2022 | 17.2 million |
| 2023 | 25.9 million |
| 2024 | 18.1 million |
| 2025 | 11.6 million |
- 404.8 million downloads of Apache OpenOffice via SourceForge from May 2012 to 20 September 2026, by the project's own download counter, downloads rather than users (Apache OpenOffice, 2026).
- 395,976,603 binary downloads of Apache OpenOffice in total by 4 January 2026, with version 4.1.16 (10 November 2025) the latest release, the project told the Apache board in January 2026 (Apache Software Foundation, 2026).
- 10 November 2025 is the release date of Apache OpenOffice 4.1.16, the latest version as of October 2026 and the first release in almost two years (Apache OpenOffice, 2025).
- 300 million downloads of Apache OpenOffice were counted from 2011 to 24 October 2020, the project announced, downloads rather than users (Apache OpenOffice, 2020).
- More than 333 million downloads of Apache OpenOffice had been counted by late August 2022, the project announced, downloads rather than users (Apache OpenOffice, 2022).
- 100 million downloads of Apache OpenOffice had been counted by April 2014, two years after its first Apache release, The Apache Software Foundation announced (Apache Software Foundation, 2014).
- 200 million downloads of Apache OpenOffice had been counted by November 2016, at a steady 100,000 a day, the project said, adding that a download may not be a user (Apache OpenOffice, 2016).
LibreOffice
- Around 100 million LibreOffice users, on a conservative basis, is The Document Foundation's own estimate for 2025, with 140 to 180 million on a higher reading of update-page visits (The Document Foundation, 2026).
- 200 million people around the world use LibreOffice, The Document Foundation said in January 2025, an estimate it lowered to around 100 million in June 2026 (The Document Foundation, 2025).
- 44.8 million downloads of LibreOffice from its official download page in 2025, the highest annual figure in the project's history, by The Document Foundation's count (The Document Foundation, 2026).
- Over 35 million downloads of LibreOffice were counted in 2024, The Document Foundation said, on an average of 28.6 million a year since 2011 (The Document Foundation, 2025).
- 400 million downloads of LibreOffice since 2011 had been counted by the end of 2024, The Document Foundation said (The Document Foundation, 2025).
- 51.2 million downloads of LibreOffice from its official download page in the twelve months from October 2025 to September 2026, by The Document Foundation's count (The Document Foundation, 2026).
- 581.6 million visits to LibreOffice's update page were counted in 2025, not deduplicated, which The Document Foundation uses to gauge its active user base (The Document Foundation, 2026).
- 1,031,162 downloads of LibreOffice 26.8 were counted in its first week (late August 2026), the most for any LibreOffice release, from the official download page only (The Document Foundation, 2026).
WPS Office
| Month | Monthly active |
|---|---|
| December 2019 (users) | 411 million |
| December 2020 (users) | 474 million |
| December 2021 (devices) | 544 million |
| December 2022 (devices) | 573 million |
| December 2023 (devices) | 598 million |
| December 2024 (devices) | 632 million |
| December 2025 (devices) | 678 million |
| June 2026 (devices) | 676 million |
- 48.25 million paying individual subscribers to WPS in mainland China over the twelve months to June 2026, up 15% in a year, Kingsoft Corporation reported (Kingsoft, 2026).
Google Workspace

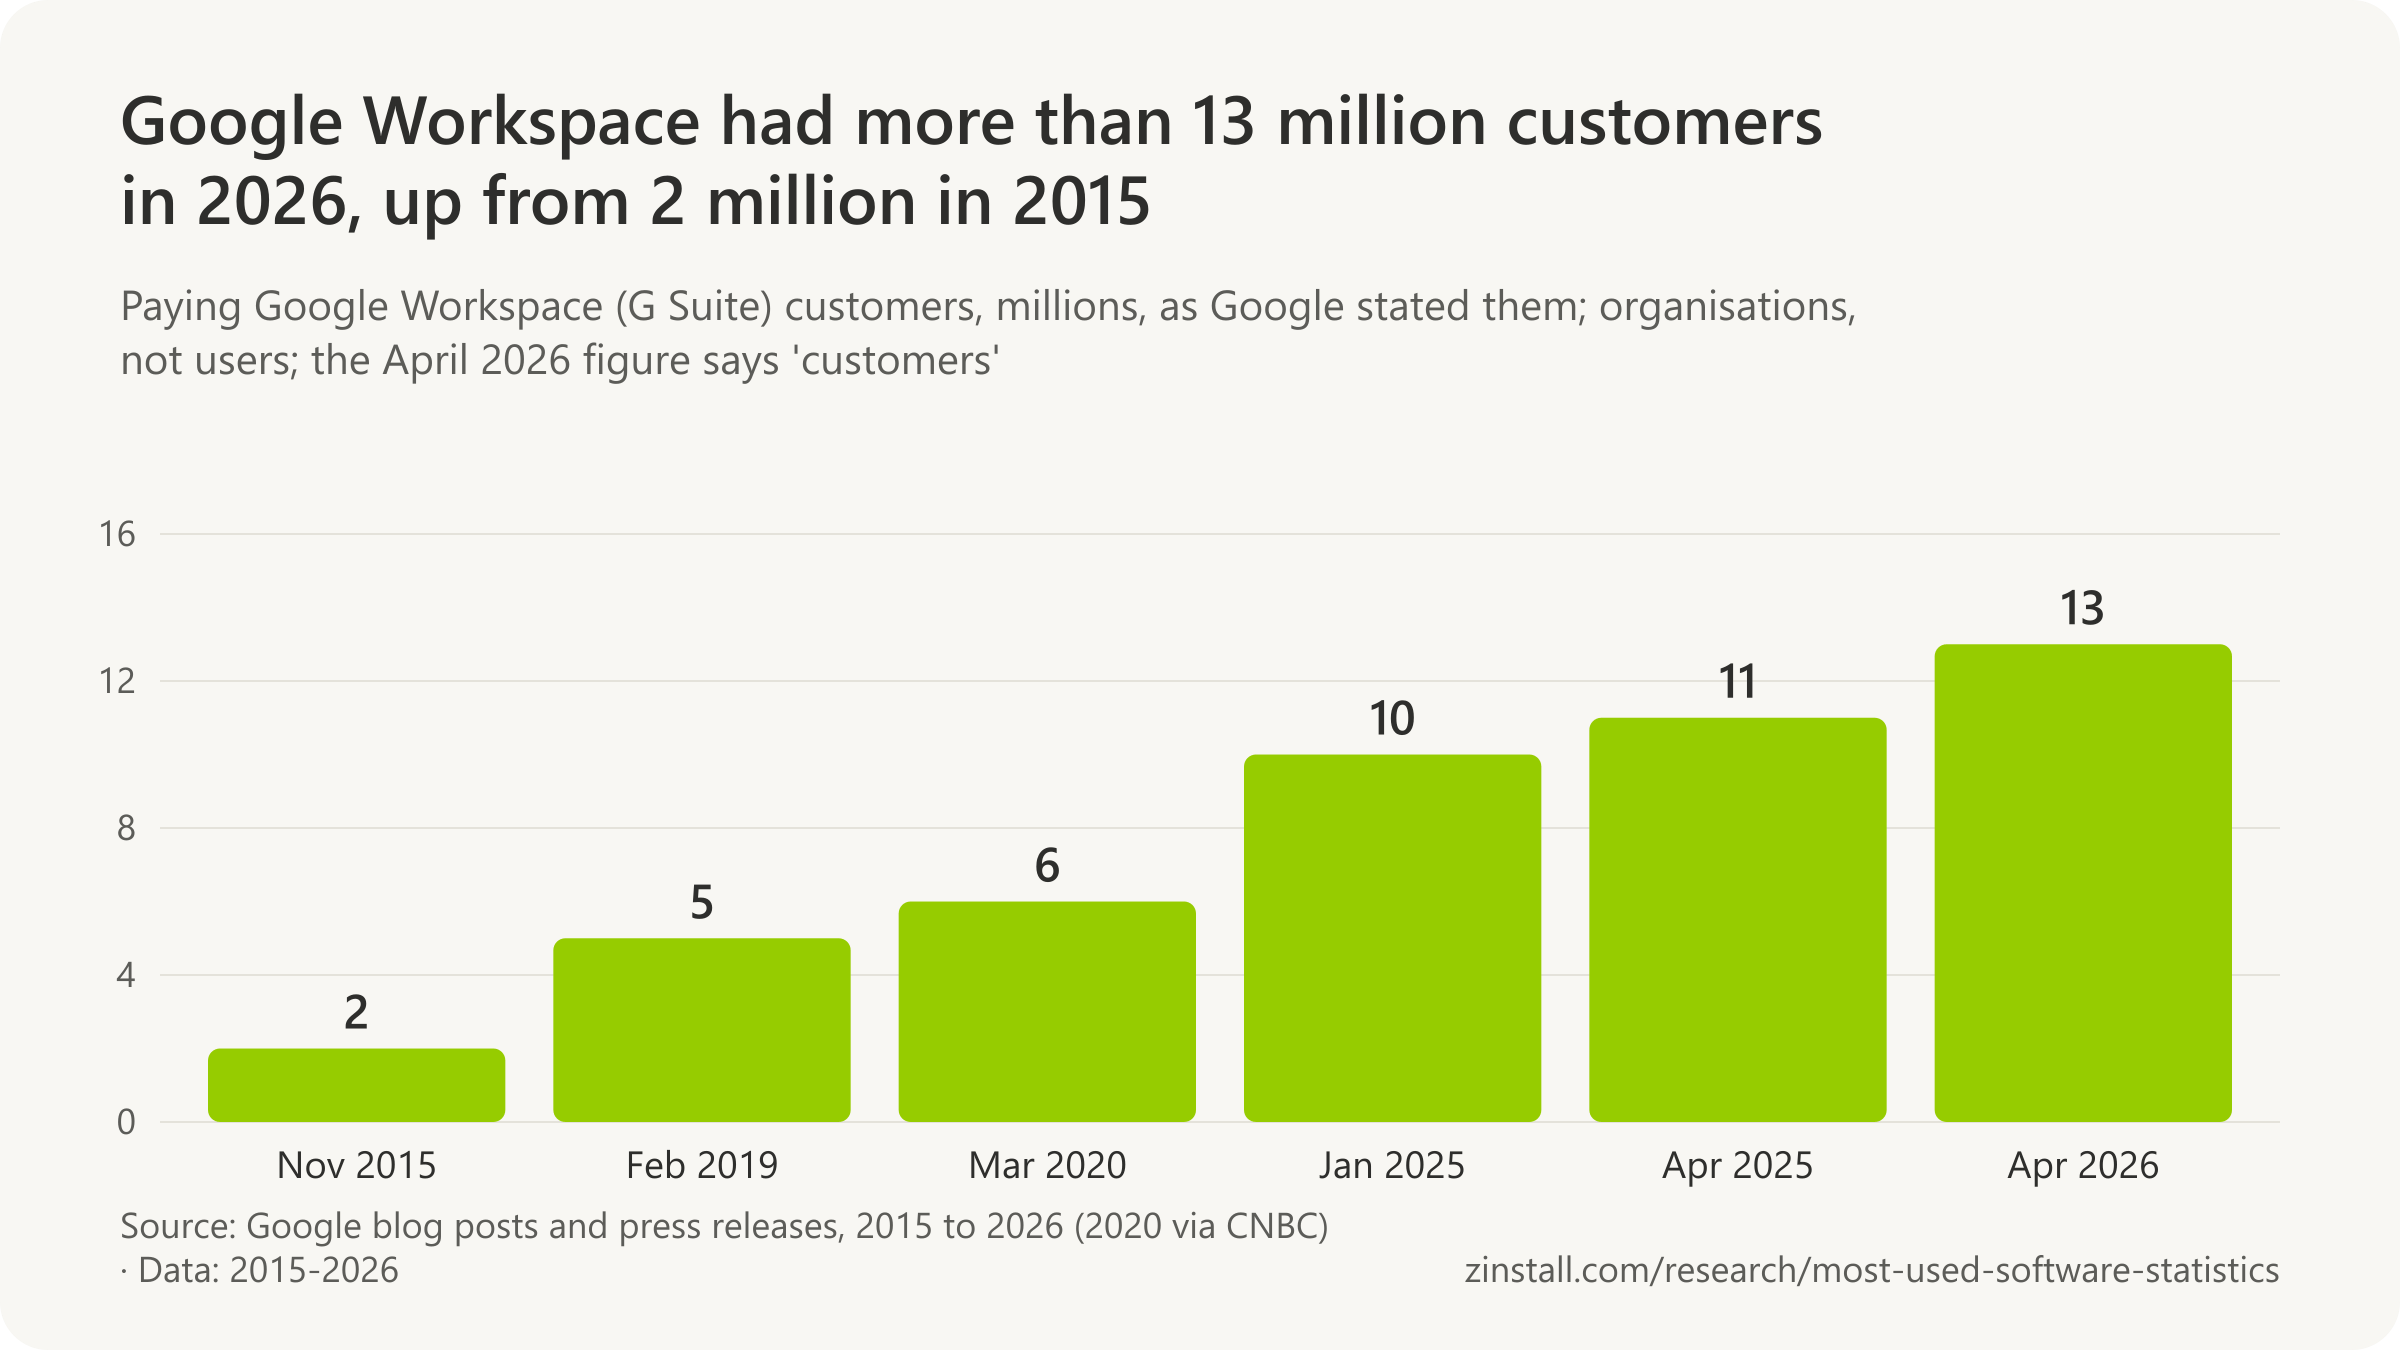
- More than 2 million paying businesses used G Suite (then Google Apps for Work, now Google Workspace) in November 2015, Google said on its Cloud blog (Google, 2015).
- More than 5 million paying businesses used G Suite in February 2019, Google said on its G Suite blog after Alphabet's fourth-quarter 2018 results (Google, 2019).
- Over 6 million paying businesses used G Suite in March 2020, Google executive Javier Soltero told CNBC (CNBC, 2020).
- More than 3 billion users had Google Workspace once Google opened it to everyone with a Google account in June 2021, Google said in October 2021, a count of accounts including free Gmail users (Google, 2021).
- Over 10 million paying customers used Google Workspace in January 2025, alongside more than 3 billion users, Google said in its press-release boilerplate (Google, 2025).
- Over 11 million paying customers used Google Workspace by April 2025, Google said in its press-release boilerplate, a figure it repeated until December 2025 (Google, 2025).
- More than 13 million customers and over 3 billion users had Google Workspace in April 2026, Google said at Cloud Next 2026, users counting free Google accounts (Google, 2026).
Microsoft and Google side by side
- 51% of Okta's customers that use Microsoft 365 also used Google Workspace in November 2024 to October 2025, the first time over half, Okta's Businesses at Work 2026 report found (Okta, 2026).
- 28% of Okta's Office 365 customers also subscribed to G Suite in late 2018, 'double bundling' themselves, Okta's Businesses at Work 2019 report found (Okta, 2019).
- 31% of Okta customers with Office 365 also used G Suite in 2019, up from 28% a year earlier and 21% in 2016, TechTarget reported from Okta's Businesses at Work 2020 report (TechTarget, 2020).
- 67% of US knowledge workers preferred Microsoft Word over Google Docs and 15% the opposite, in Okta's survey of over 1,200 workers in December 2018 and January 2019 (Okta, 2019).
- 8.5% of public companies used Office 365 for cloud email and 4.7% used Google Apps for Work, in Gartner's 2016 scan of nearly 40,000 companies' email routing records (Gartner, 2016).
Other office suites
- Over 10 million iWork users (Pages, Numbers and Keynote) was the figure Apple gave in January 2013, the only iWork user count Apple has published; iWork became free in 2013 and 2017 (Apple, 2013).
- More than 21 million users trust ONLYOFFICE worldwide, its developer Ascensio System says on its home page in October 2026, a claim with no stated method (ONLYOFFICE, 2026).
- Over 450,000 customers use Zoho Workplace (Zoho's mail and office suite), Zoho says on its product page in October 2026 (Zoho, 2026).
- More than 20 million customers worldwide used WordPerfect Office 12, Corel said in March 2005, the last user figure published for WordPerfect (Computerworld, 2005).
Numbers in circulation
- Computerworld reported in March 2025 that The Document Foundation estimated around 200 million LibreOffice users while saying it does not track users and cannot be sure (Computerworld, 2025).
- TechCrunch reported in February 2010 that OpenOffice.org had been downloaded 300 million times since 2002, the Sun-era count that roundups confuse with Apache OpenOffice's 2020 milestone (TechCrunch, 2010).
- More than 600 million monthly active users of WPS Office, WPS's own About page says, recasting its parent's monthly active devices as users (WPS, 2026).
- About Chromebooks wrote in February 2026 that Google Workspace had over 3 billion monthly active users and 11 million paying customers 'according to Alphabet's Q4 2025 earnings report', two claims Google's own sources do not support (About Chromebooks, 2026).
Sources: Apache OpenOffice (2016-2026); The Apache Software Foundation (2014, 2026); The Document Foundation (2025, 2026); Kingsoft Corporation (2020-2026); Google (2015-2026); CNBC; Okta (2019, 2026); TechTarget; Gartner; Apple; Ascensio System SIA; Zoho Corporation; Computerworld (2005, 2025); TechCrunch; WPS Software; About Chromebooks
What is the most used web browser?
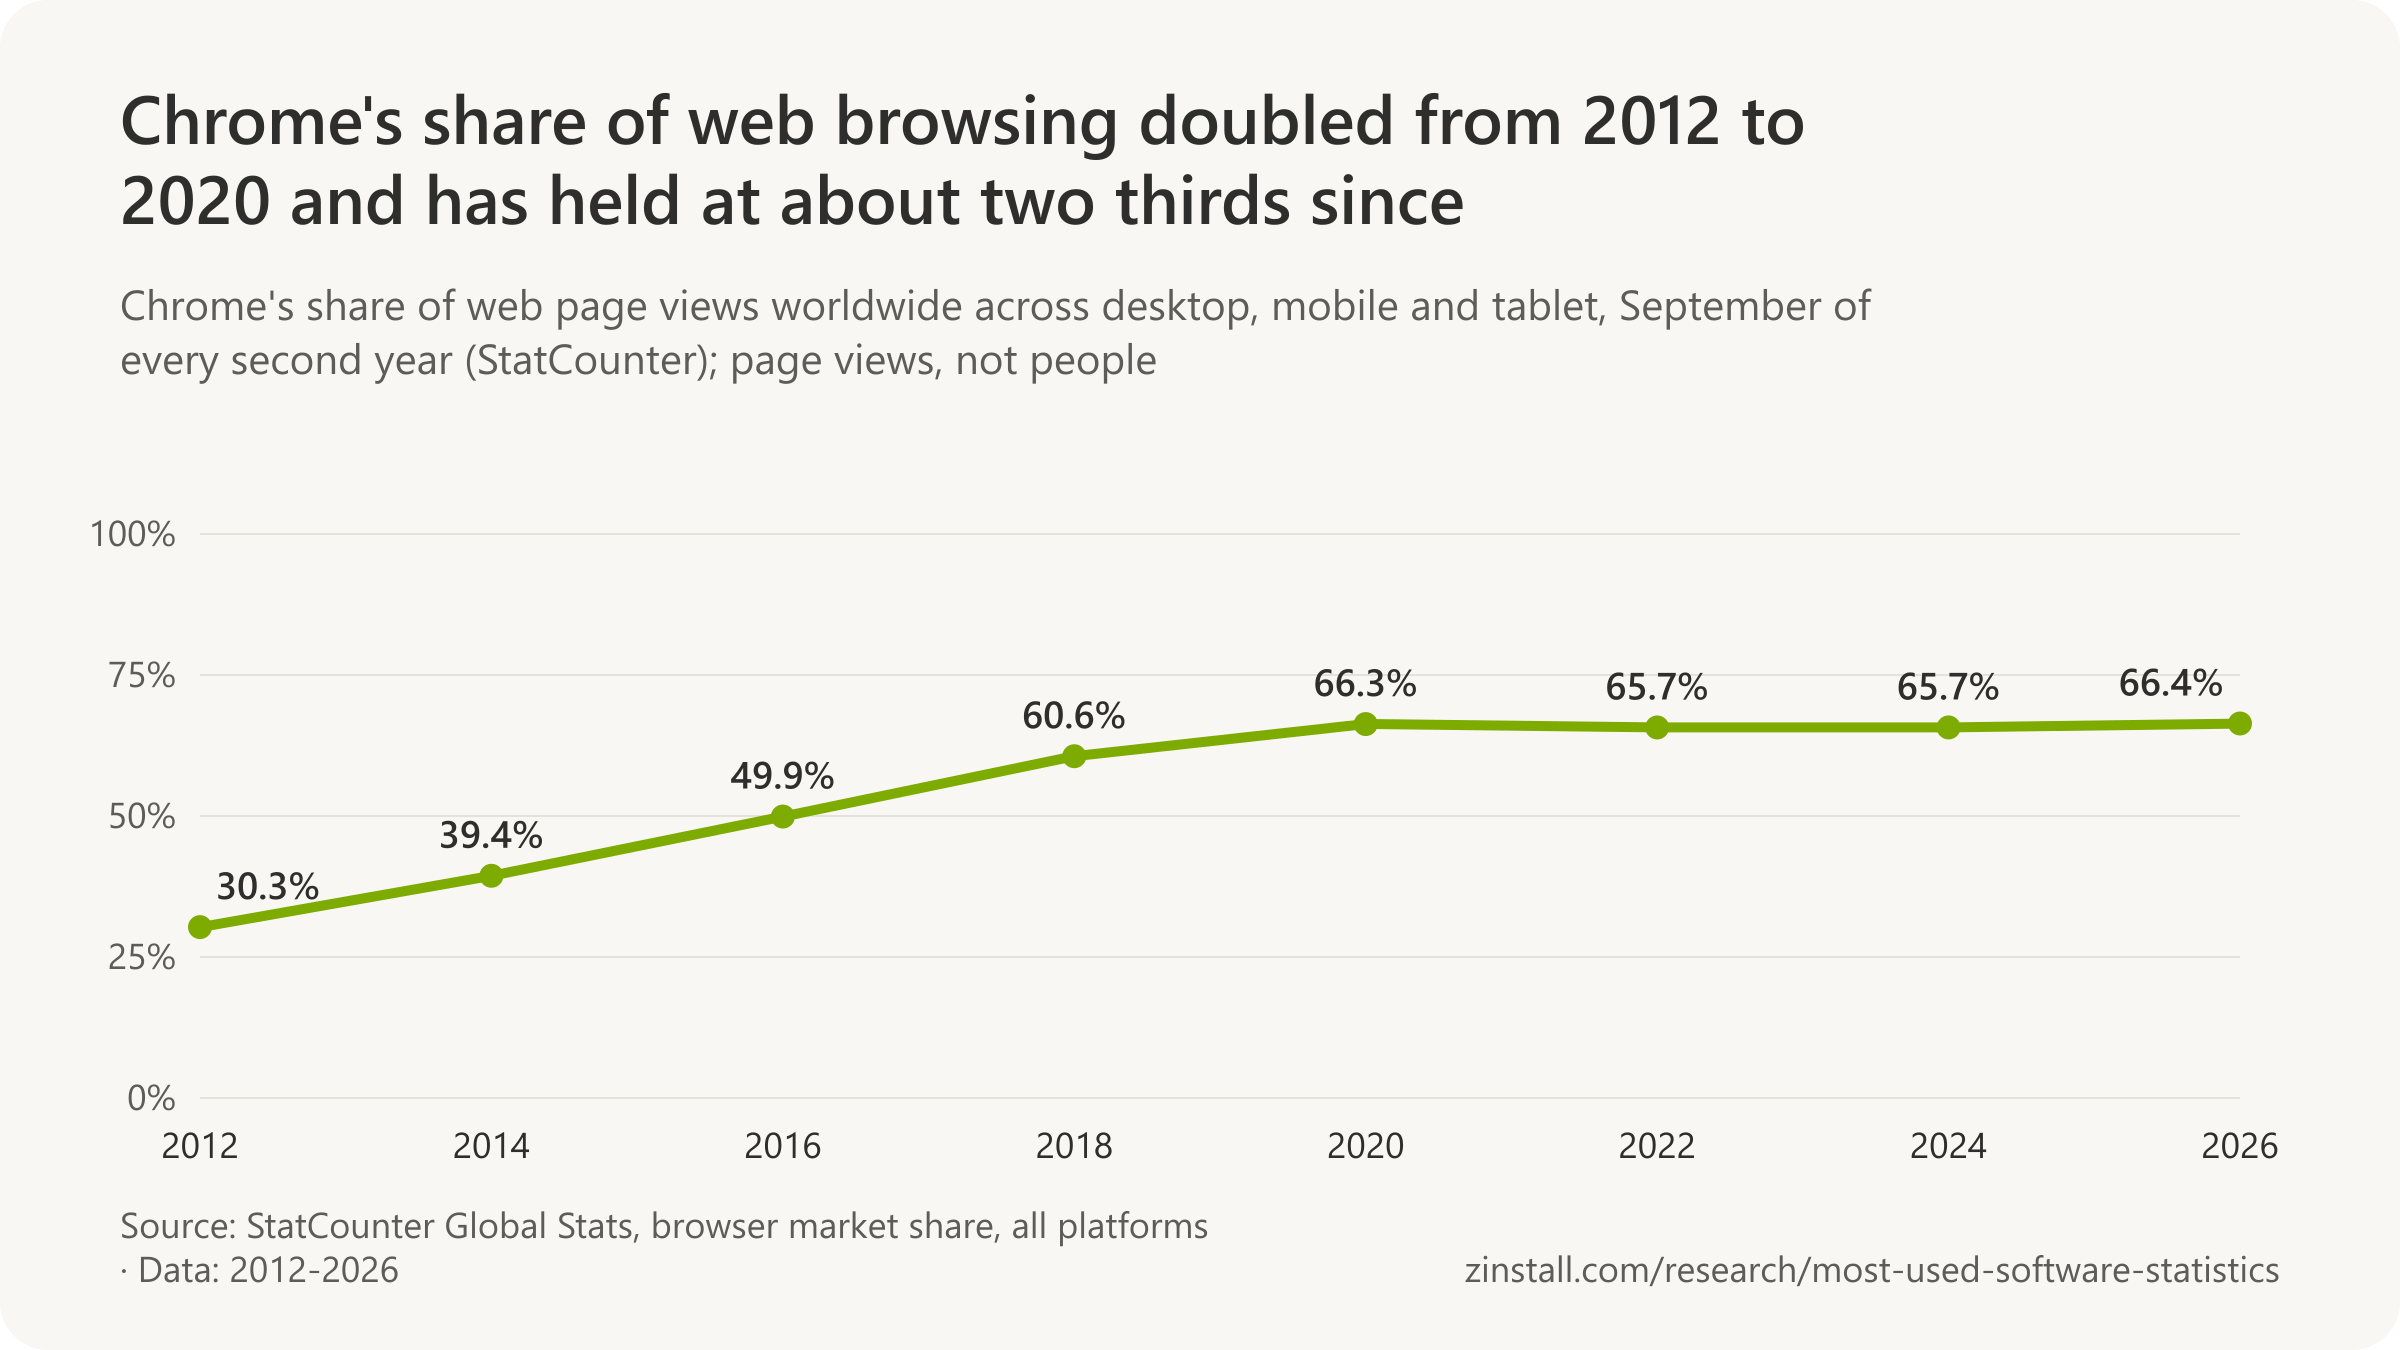
Chrome accounted for 66.4% of web page views worldwide in September 2026, across desktops, phones and tablets (StatCounter, 2026).

- Safari was the second most used browser worldwide in September 2026, with 18.3% of web page views.
- On desktops, Edge overtook Safari for second place in February 2022, at 9.9%.
- Firefox had 211.9 million monthly active clients (installations) on desktop and mobile in October 2026, by Mozilla's count.
- Two thirds of the browser traffic reaching Cloudflare's network in 2025 came from Chrome.
- Windows ran 76.4% of desktop page views in September 2026, and macOS 16.8%.
| Browser | Share of desktop page views |
|---|---|
| Chrome | 65.1% |
| Edge | 14.6% |
| Safari | 8.1% |
| Firefox | 6.1% |
| Opera | 2.4% |
| Brave | 1.1% |
Sources: StatCounter (2026); Mozilla; Cloudflare
Moving these programs to a new computer: Google Chrome · Firefox
More statistics (125)
Browser shares come from trackers that count page views on the websites carrying their code (StatCounter) or requests through their network (Cloudflare), not people. The browser makers' own user counts appear further down, each in the measure its maker uses.
Browser shares in September 2026
| Browser and platform | Share of page views |
|---|---|
| Chrome, all platforms | 66.4% |
| Safari, all platforms | 18.3% |
| Edge, all platforms | 6.0% |
| Firefox, all platforms | 2.8% |
| Samsung Internet, all platforms | 2.3% |
| Opera, all platforms | 1.8% |
| Chrome, desktop | 65.1% |
| Edge, desktop | 14.6% |
| Safari, desktop | 8.1% |
| Firefox, desktop | 6.1% |
| Opera, desktop | 2.4% |
| Brave, desktop | 1.1% |
| Chrome, mobile | 67.6% |
| Safari, mobile | 24.7% |
| Samsung Internet, mobile | 3.5% |
| Firefox, mobile | 0.7% |
- 3 billion page views per month from more than 1 million websites is the sample StatCounter says its Global Stats, including its browser and operating system shares, are based on (StatCounter, 2026).
- Page views, not unique visitors or devices, are what StatCounter counts, so a browser that loads 500 pages weighs 500 times one that loads a single page (StatCounter, 2026).
Browser shares since 2012

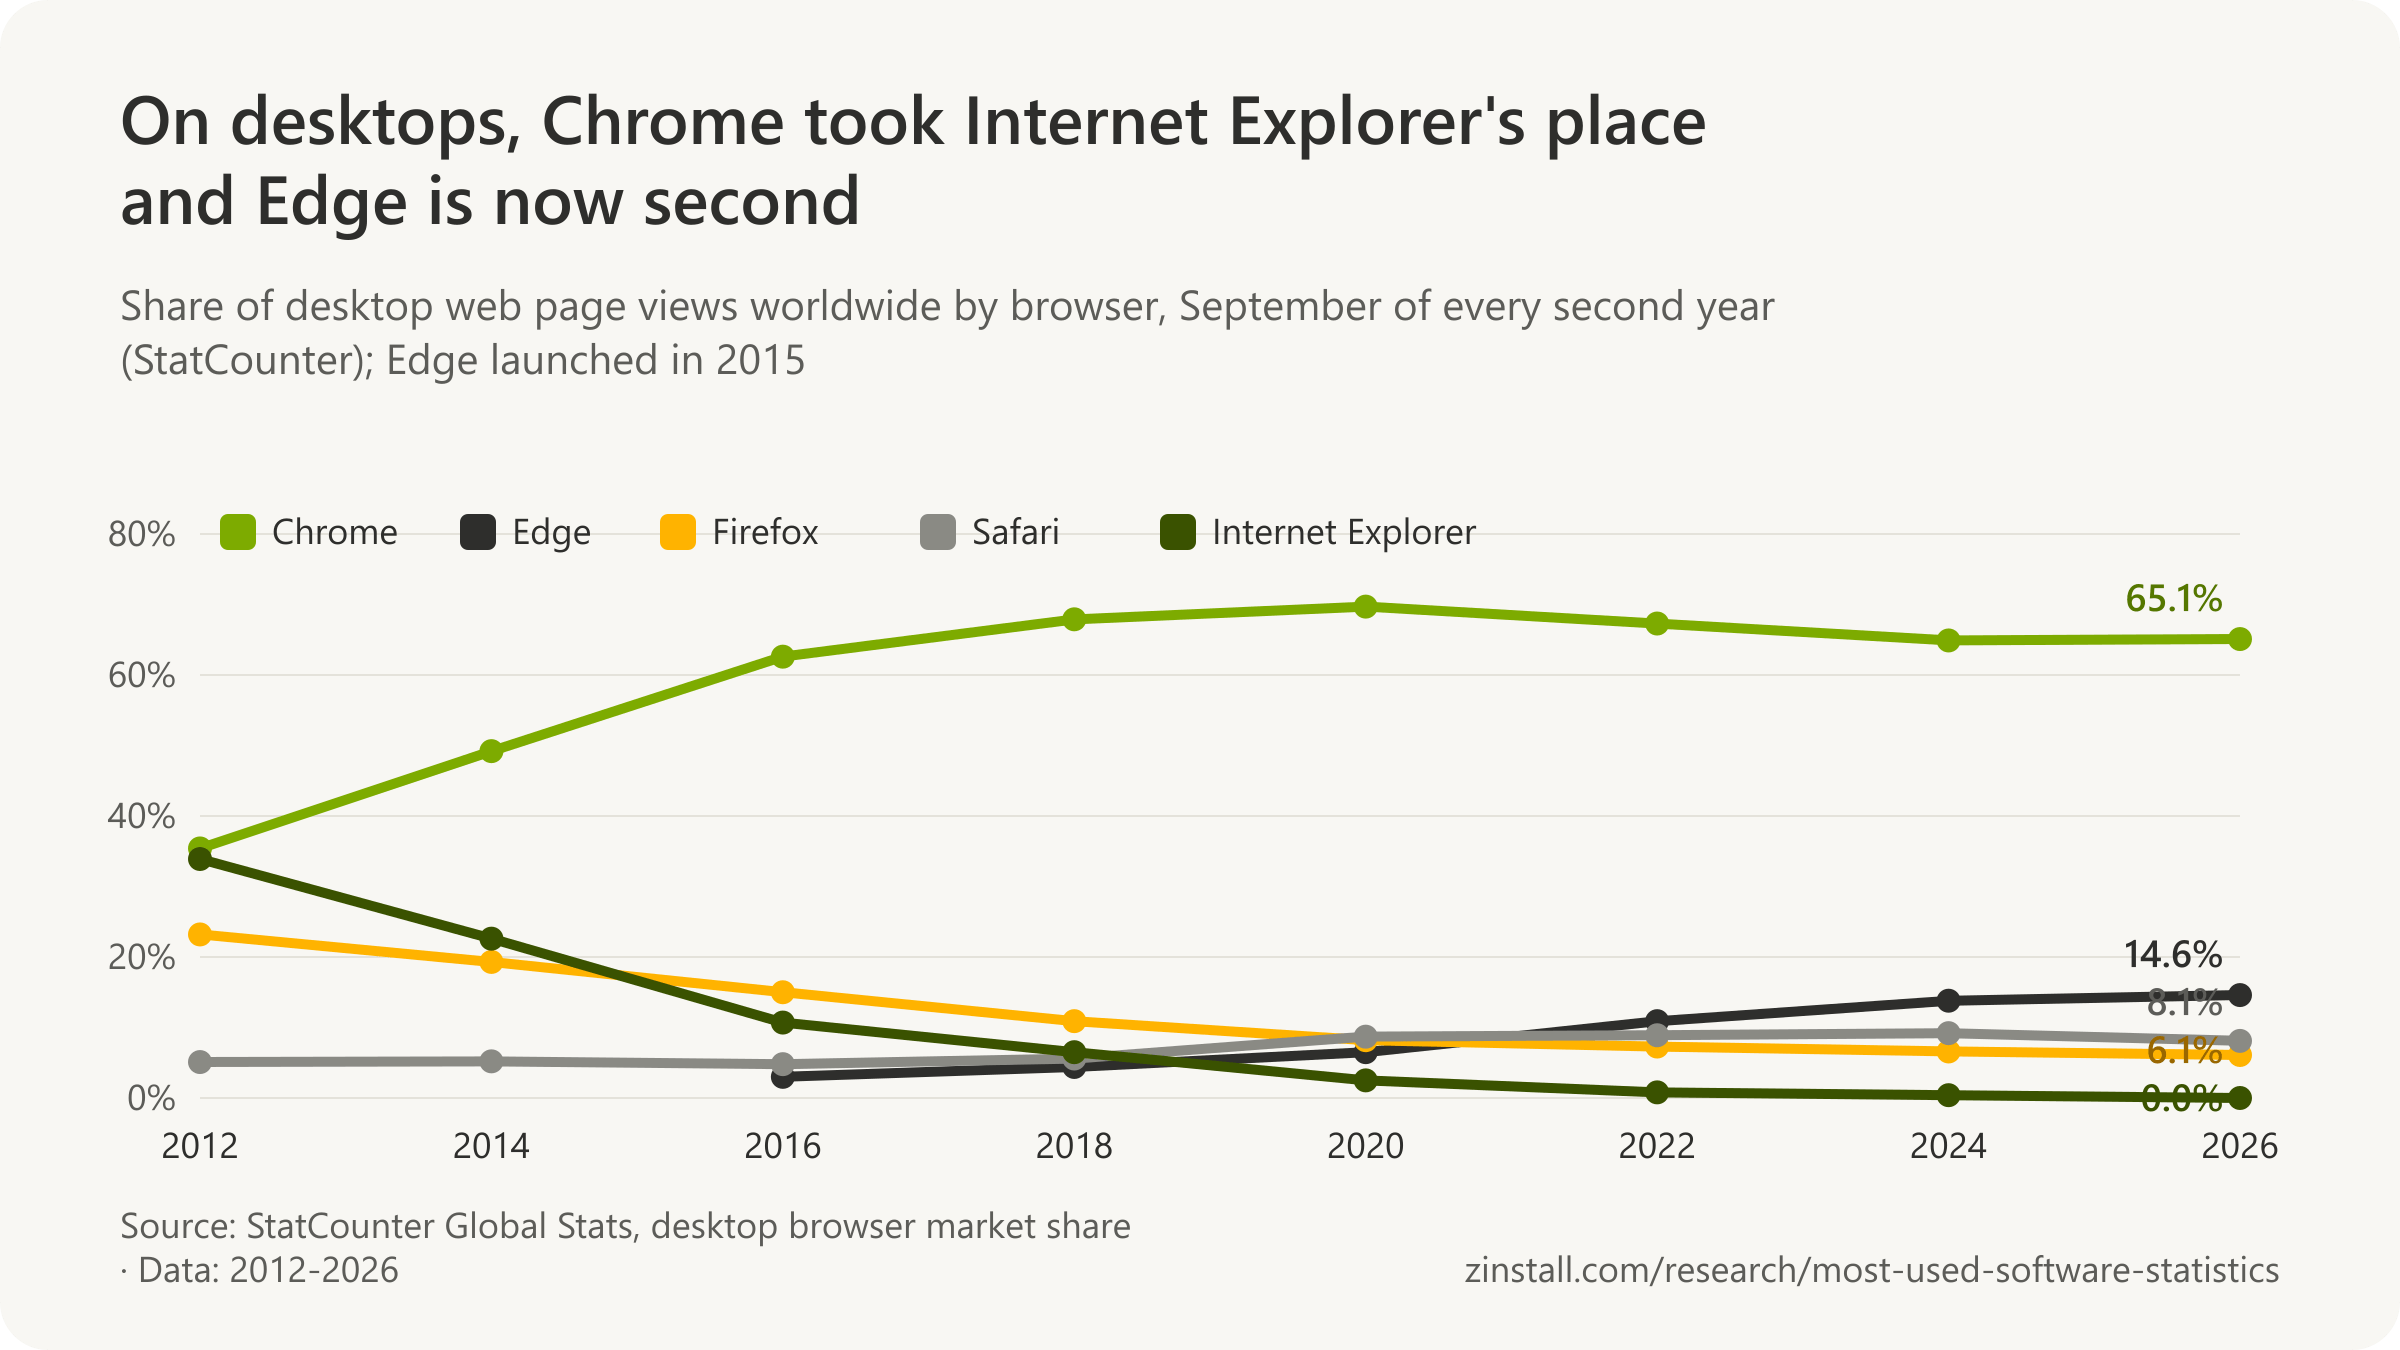
- 32.4% of desktop web page views worldwide came from Chrome in May 2012, against 32.1% from Internet Explorer, the first month Chrome led on desktop in StatCounter's data (StatCounter, 2026).
- 8.3% of desktop web page views worldwide came from Microsoft Edge in January 2021, against 8.1% from Firefox, the first month Edge passed Firefox on desktop in StatCounter's data (StatCounter, 2026).
- 9.9% of desktop web page views worldwide came from Microsoft Edge in February 2022, against 9.8% from Safari, the first month Edge was the second desktop browser after Chrome in StatCounter's data (StatCounter, 2026).
Chrome's share by country
| Country and platform | Share of page views |
|---|---|
| United States, all platforms | 53.8% |
| United States, desktop | 60.8% |
| United Kingdom, all platforms | 49.9% |
| United Kingdom, desktop | 49.8% |
| Germany, all platforms | 57.6% |
| Germany, desktop | 41.8% |
| France, all platforms | 59.5% |
| France, desktop | 57.0% |
| Japan, all platforms | 52.8% |
| Japan, desktop | 56.5% |
| India, all platforms | 88.6% |
| India, desktop | 81.8% |
| Brazil, all platforms | 77.1% |
| Brazil, desktop | 75.6% |
Cloudflare's count of browser traffic

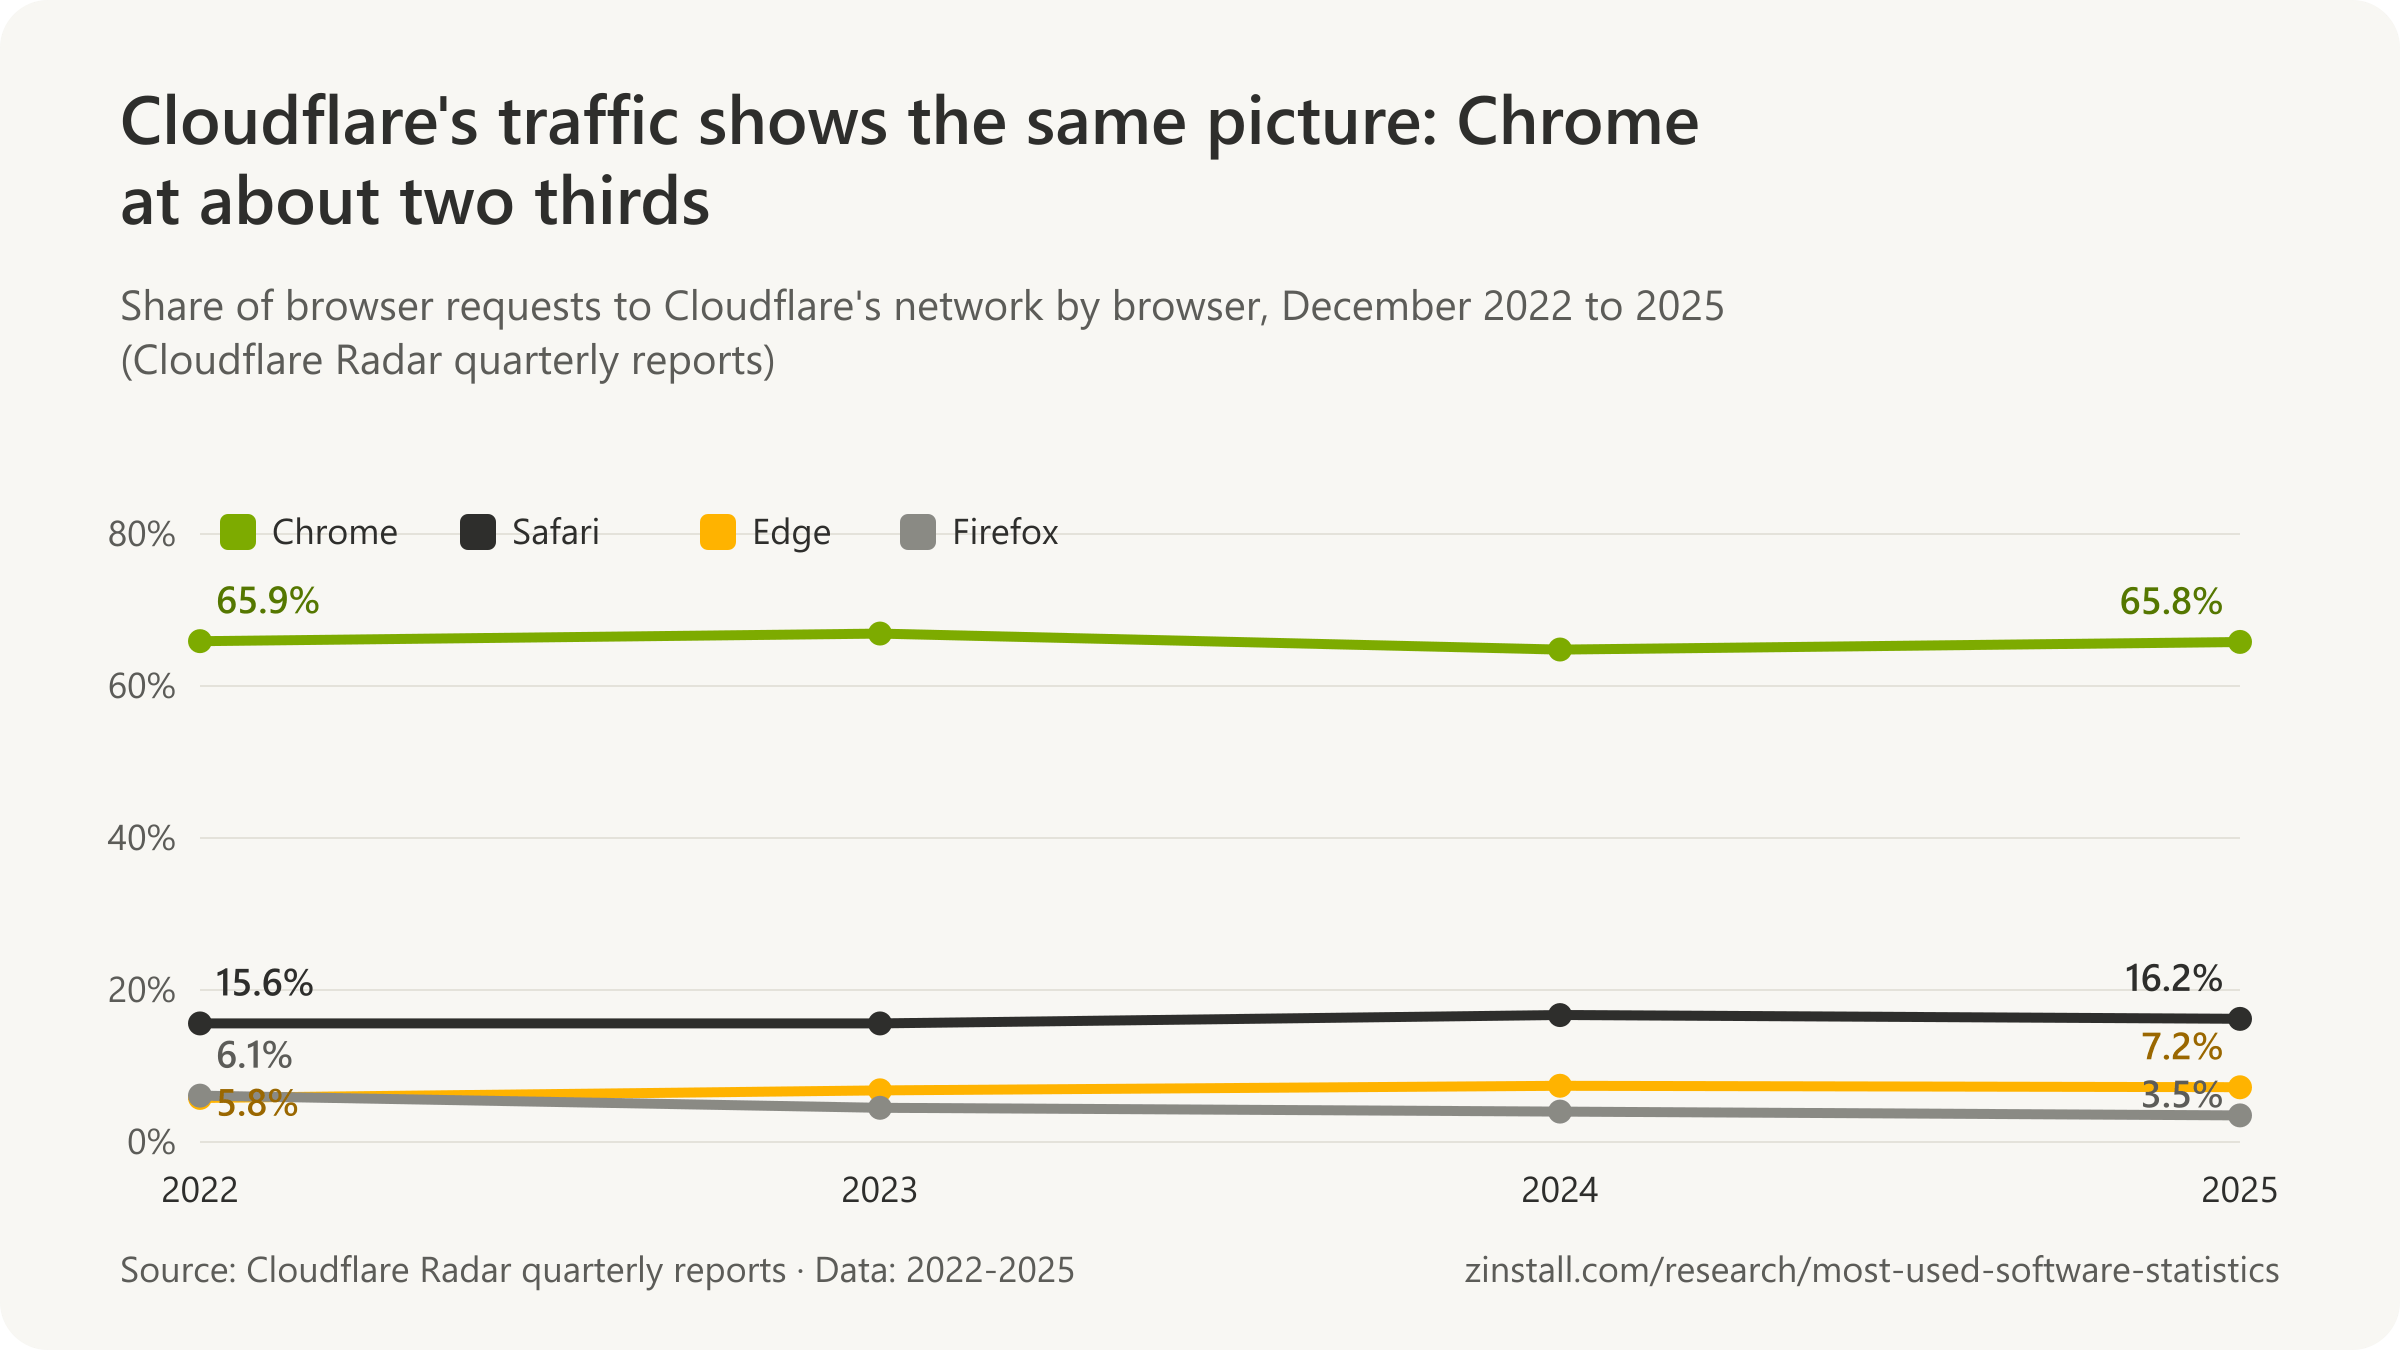
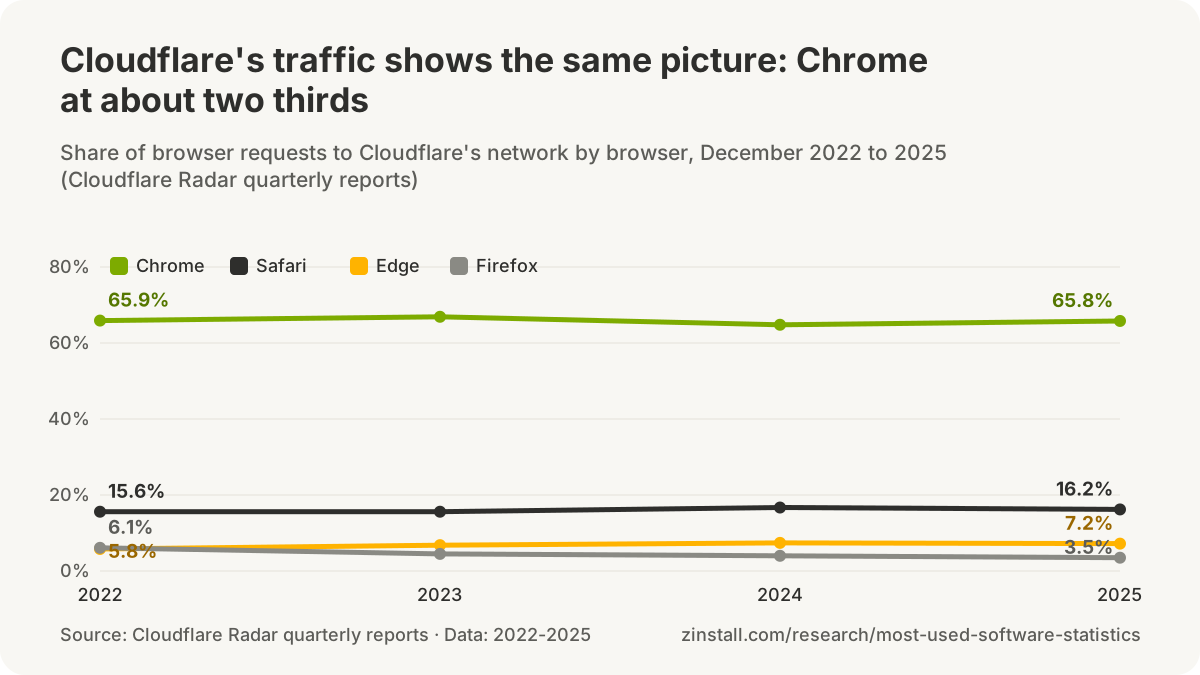
- Two-thirds of browser request traffic reaching Cloudflare's network in 2025 came from Chrome, against 15.4% from Safari, 7.4% from Microsoft Edge and 3.7% from Firefox (Cloudflare Radar, 2025).
- 19% of browser requests from Windows computers to Cloudflare's network in 2025 came from Microsoft Edge, Windows' default browser, against 69% from Chrome (Cloudflare Radar, 2025).
- 79% of browser requests from iOS devices to Cloudflare's network in 2025 came from Safari, four times Chrome's 19% (Cloudflare Radar, 2025).
- 65.9% of browser requests to websites on Cloudflare's network came from Chrome in December 2022, against 15.6% from Safari, 6.1% from Firefox and 5.8% from Microsoft Edge (Cloudflare Radar, 2023).
- 66.9% of browser requests to websites on Cloudflare's network came from Chrome in December 2023, against 15.6% from Safari, 6.8% from Microsoft Edge and 4.5% from Firefox (Cloudflare Radar, 2024).
- 64.8% of browser requests to websites on Cloudflare's network came from Chrome in December 2024, against 16.7% from Safari, 7.4% from Microsoft Edge and 4.0% from Firefox (Cloudflare Radar, 2025).
- 65.8% of browser requests to websites on Cloudflare's network came from Chrome in December 2025, against 16.2% from Safari, 7.2% from Microsoft Edge and 3.5% from Firefox (Cloudflare Radar, 2026).
- 14.2% of browser requests from desktop computers to websites on Cloudflare's network came from Microsoft Edge in December 2025, against 68.5% from Chrome, 6.4% from Safari and 6.3% from Firefox (Cloudflare Radar, 2026).
- 1.3% of browser requests to websites on Cloudflare's network came from Brave in December 2025, up from 0.8% in December 2024 (Cloudflare Radar, 2026).
- 0.27% of browser requests to websites on Cloudflare's network came from the DuckDuckGo browser in December 2025, and 0.64% of requests from iOS devices (Cloudflare Radar, 2026).
Chrome and Edge users, as Google and Microsoft counted them
- 310 million active users used Chrome worldwide in June 2012, nearly double the 160 million of a year earlier, Google said at its I/O developer conference (Google, 2012).
- More than 750 million active users used Chrome in May 2013, Google said at its I/O developer conference (Google, 2013).
- More than 2 billion active Chrome browsers were in use worldwide in November 2016, most of them on mobile devices, Google said (Google, 2016).
- Over 1 billion monthly active users was the level Alphabet said Chrome exceeded in its 10-K for 2019, alongside Android, Gmail, Google Drive, Maps, Play, Search and YouTube (Alphabet, 2020).
- Over 2 billion monthly users used Chrome as of Google I/O in May 2024, when it was one of six Google products above that level, 9to5Google reported from Google's keynote; Google Maps became the seventh in October 2024 (9to5Google, 2024).
- More than 1 billion Chrome users had switched on Enhanced Protection, the strongest Safe Browsing mode, by February 2025, Google said, a floor for Chrome's user base rather than a total (Google, 2025).
- More than 330 million monthly active devices ran Microsoft Edge in September 2017, Microsoft said at its Edge Web Summit, more than double the 150 million it reported in April 2016 (Windows Central, 2017).
- 600 million 'customers' reached by Microsoft Edge was the wording of a Microsoft job listing reported in January 2021; Windows Central corrected its first reading of '600 million people' and Microsoft never published it as a user count (Windows Central, 2021).
Firefox, Opera, Brave and DuckDuckGo

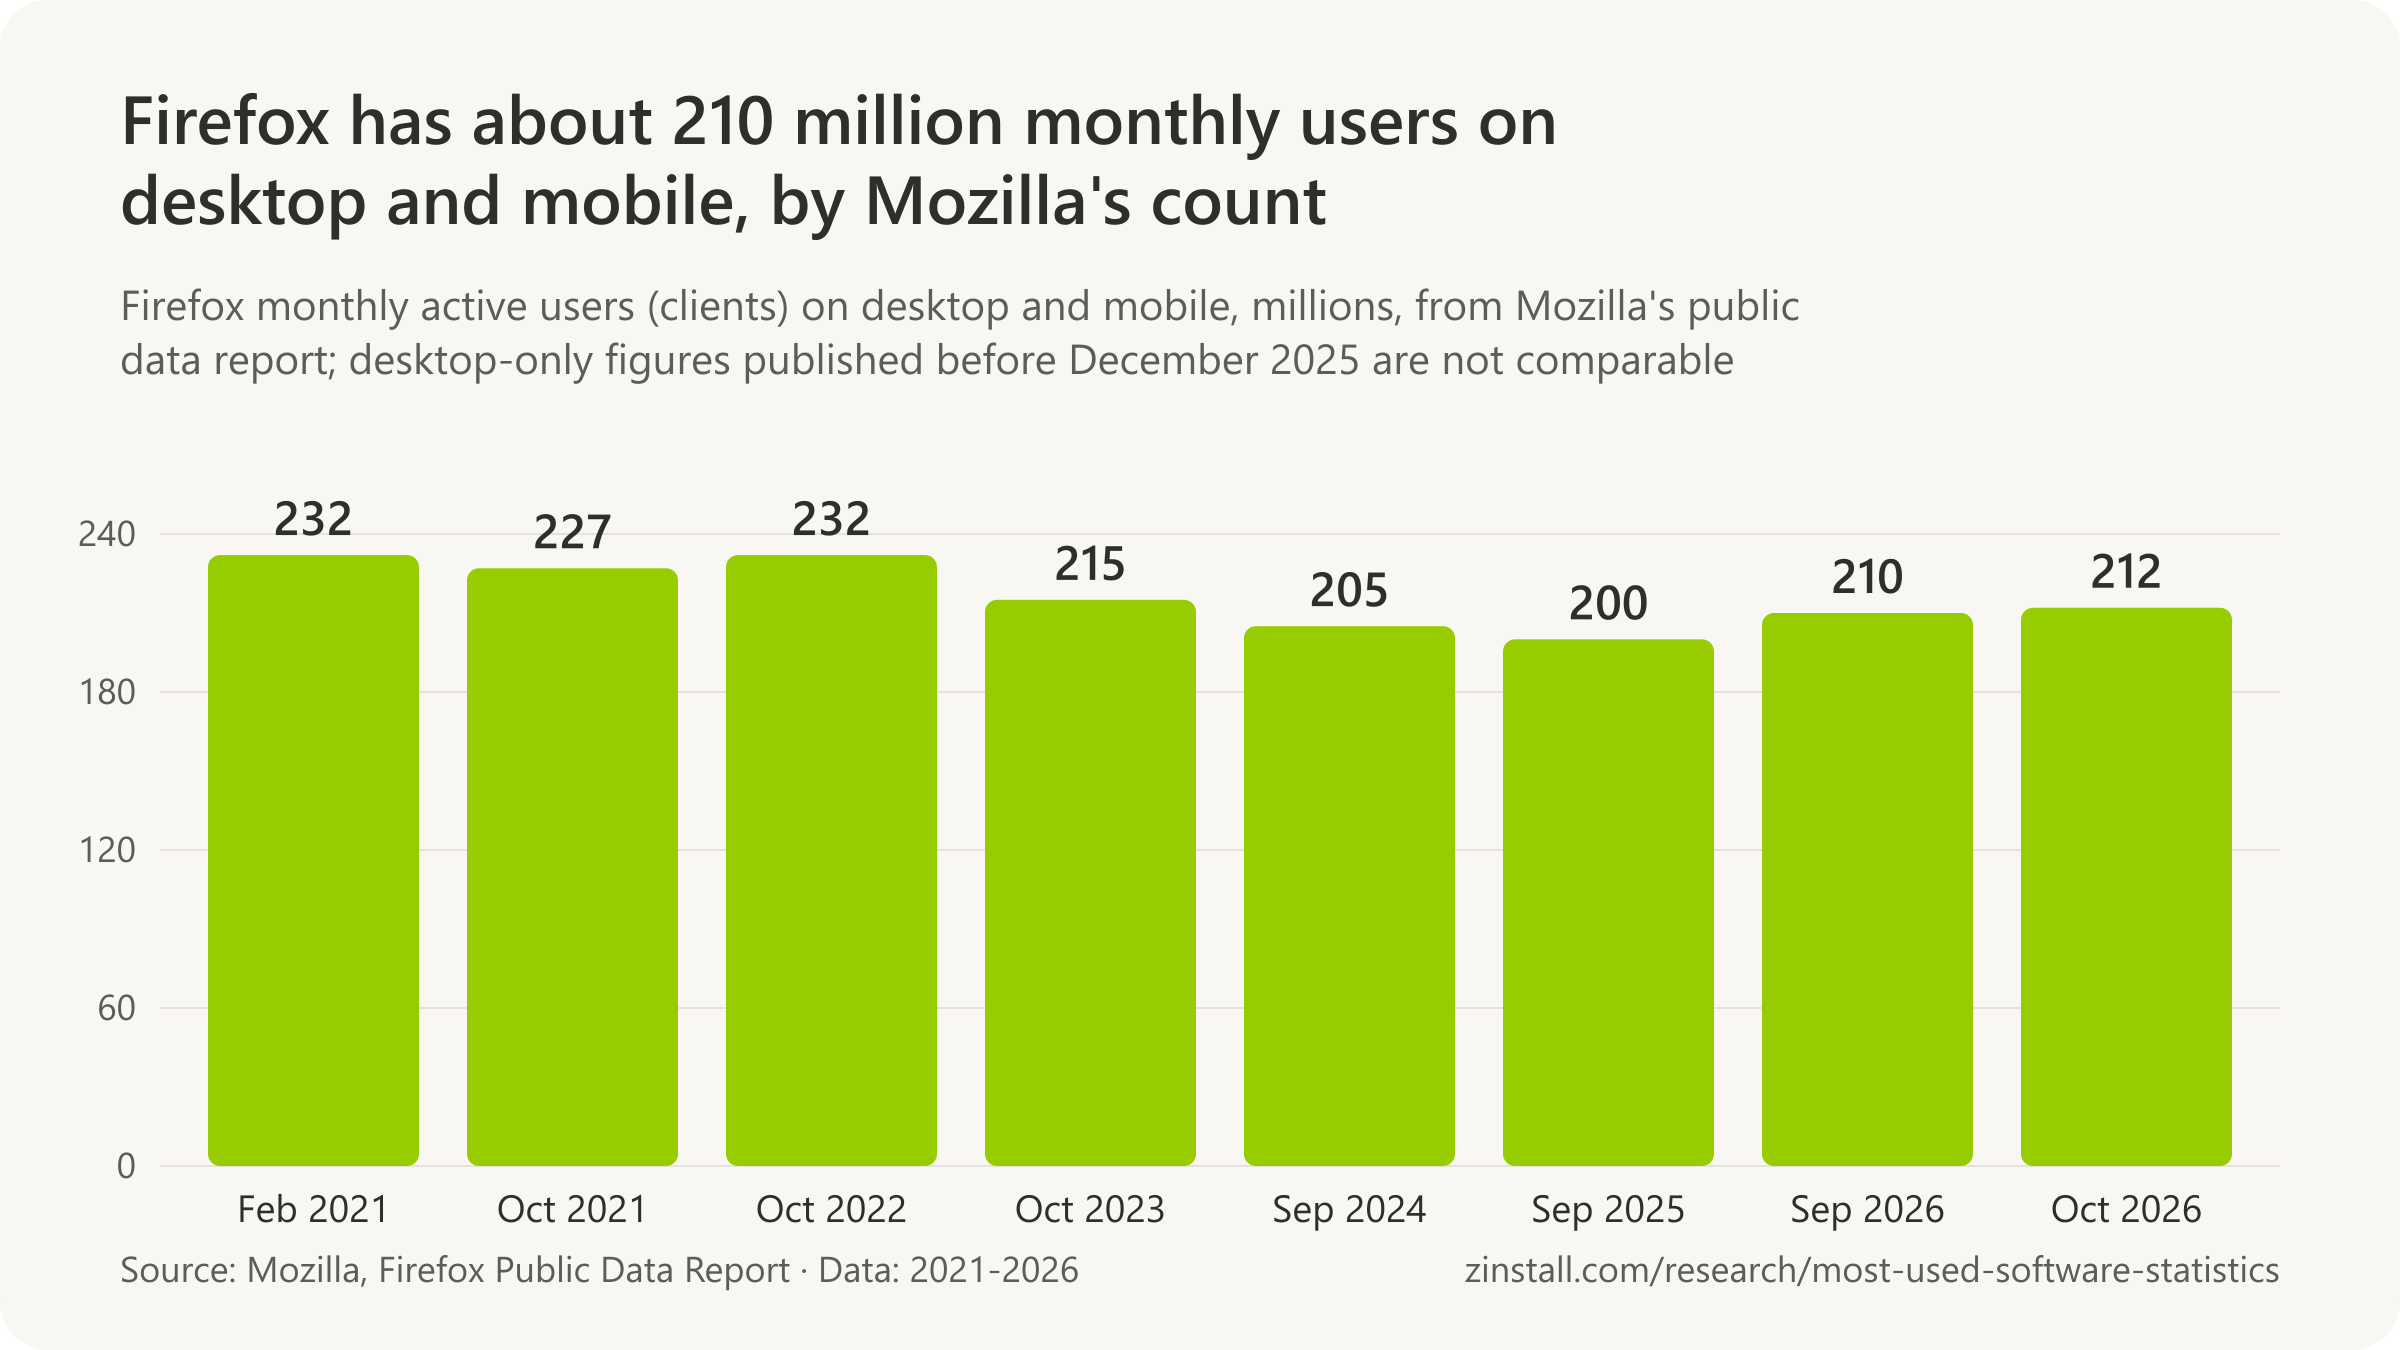
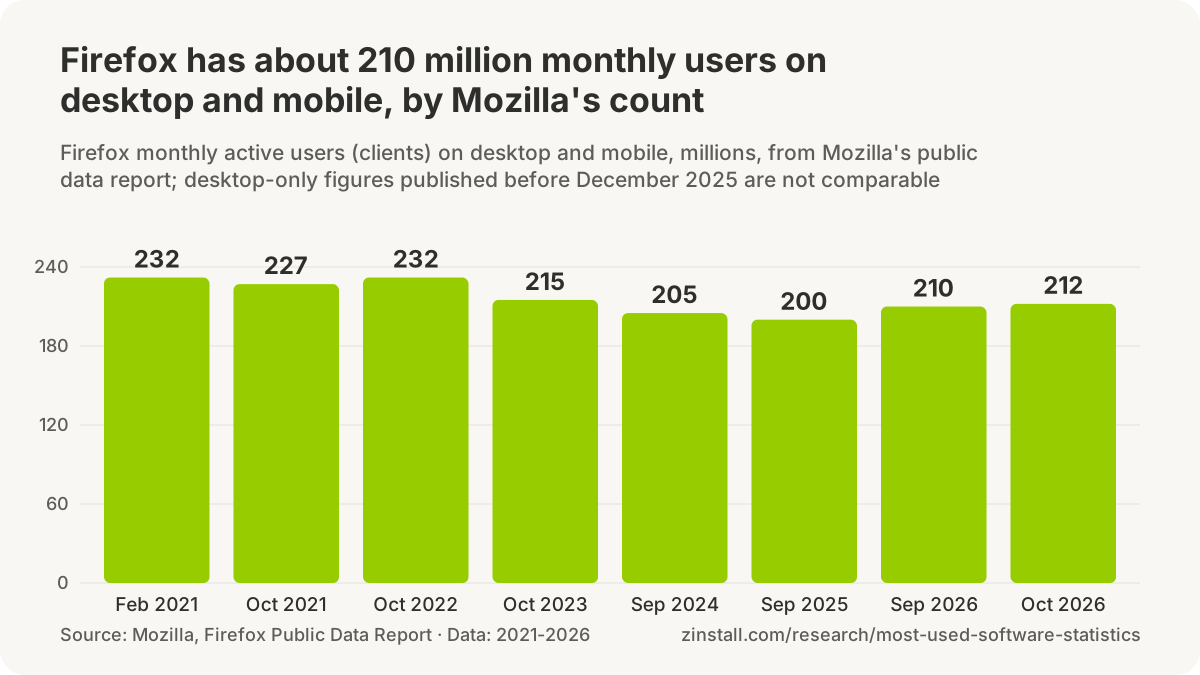
- 211.9 million monthly active Firefox clients on desktop and mobile combined were counted by Mozilla for the week of 5 October 2026, in its Firefox Public Data Report (Mozilla, 2026).
- 154.4 million monthly active Firefox desktop clients were counted by Mozilla for the week of 3 November 2025, the last desktop-only figure before its Public Data Report switched to desktop and mobile combined (Mozilla, 2025).
- Between 15 November and 18 December 2025 Mozilla changed the monthly active user measure in its Firefox Public Data Report from desktop clients only to desktop and mobile clients combined, and restated the series from February 2021 on the new basis (Mozilla, 2025).
- 312.9 million monthly active Firefox desktop clients were counted by Mozilla for the week of 1 April 2017, the first point of its Public Data Report as published in April 2020, falling to 253.2 million by December 2019 (Mozilla, 2020).
- 804.8 million Firefox desktop clients were active at least once in the year to 14 December 2019 (yearly active users), down from 878.5 million in the year to 1 April 2017, by Mozilla's count (Mozilla, 2020).
- Firefox's monthly active desktop clients fell 22% from 198.0 million at the end of 2018 to 154.4 million in November 2025, on the desktop series Mozilla published in 2025 (Mozilla, 2025).
- 187.7 million monthly active Firefox desktop clients were reported by Mozilla for the week of 4 December 2023 when first published; by 2025 Mozilla had restated the same week to 172.1 million for desktop alone (Mozilla, 2023).

- 288 million average monthly active users used Opera's browsers and apps in the second quarter of 2026, by Opera's count in its quarterly results (Opera, 2026).
- 37 million average monthly active users used Opera GX, Opera's gaming browser, on PC and mobile in the second quarter of 2026, up 10% in a year, Opera said (Opera, 2026).
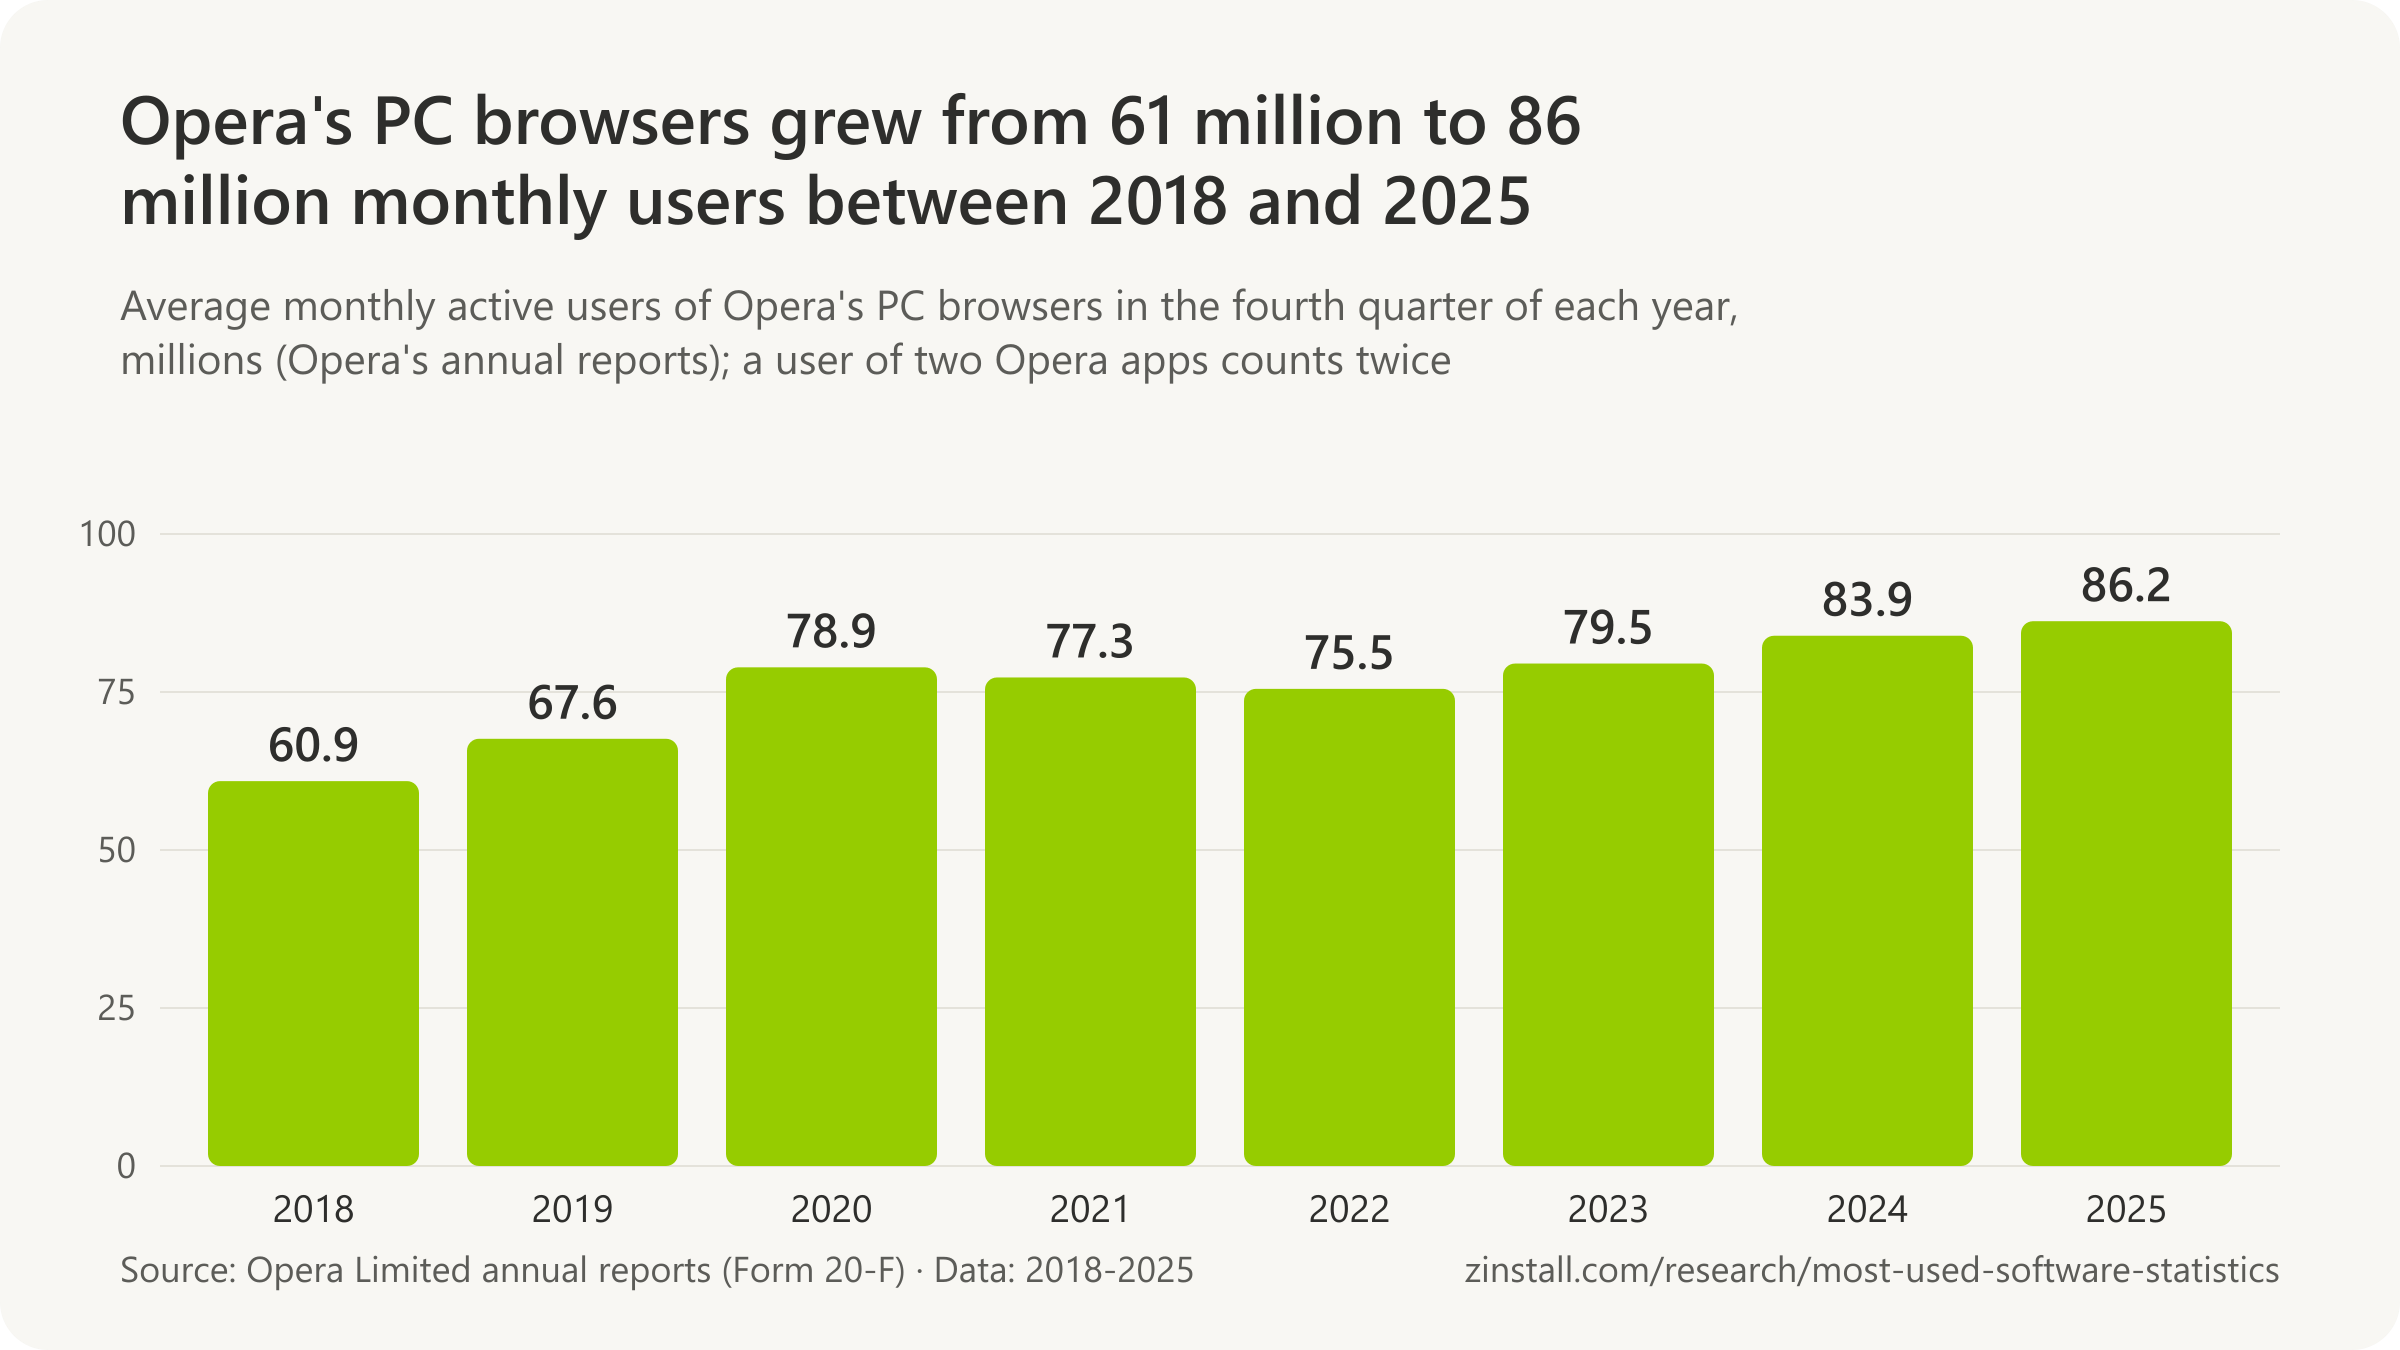
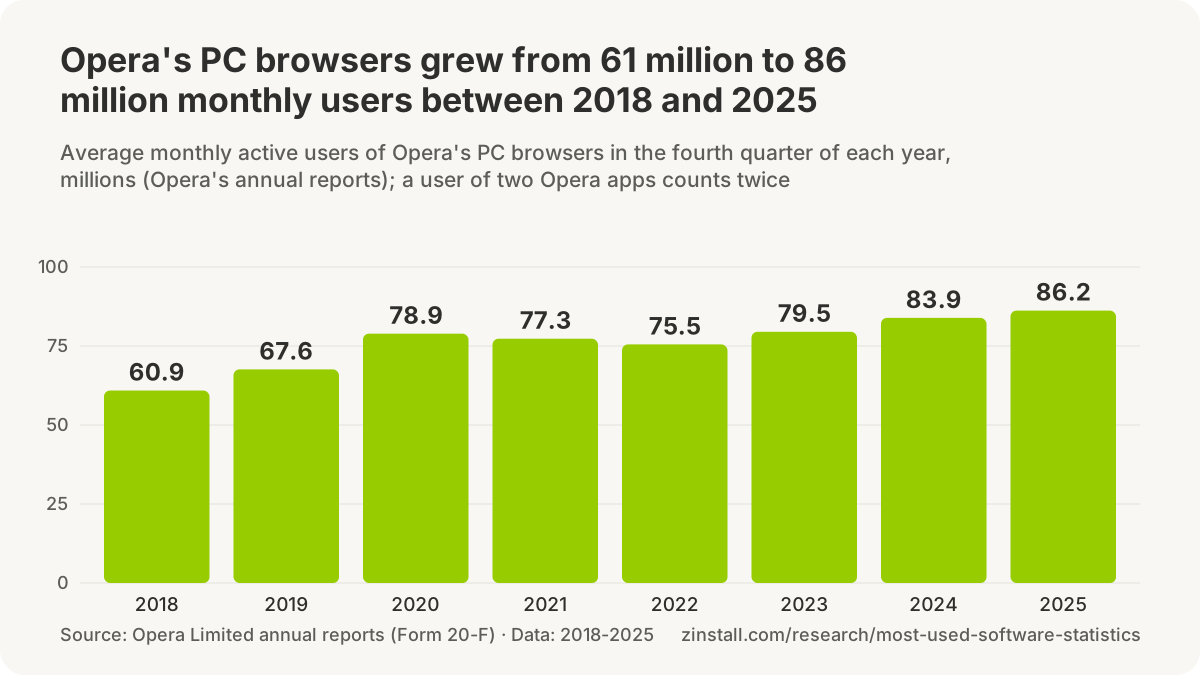
- 86.2 million average monthly active users used Opera's desktop (PC) browsers in the fourth quarter of 2025, against 167.2 million on smartphones and 30.7 million on feature phones, by Opera's count (Opera, 2026).
- 284.3 million average monthly active users used Opera's products in the fourth quarter of 2025, down from 303.6 million in the first quarter of 2024, about 258 million of them on its browsers, by Opera's count (Opera, 2026).
- 79.5 million average monthly active users used Opera's PC browsers in the fourth quarter of 2023, up from 75.5 million a year earlier, by Opera's count (Opera, 2024).
- 77.3 million average monthly active users used Opera's PC browsers in the fourth quarter of 2021, against 78.9 million a year earlier, while Opera's total fell from 381.4 million to 343.1 million (Opera, 2022).
- 67.6 million average monthly active users used Opera's PC browsers in the fourth quarter of 2019, up from 60.9 million a year earlier, by Opera's count (Opera, 2020).

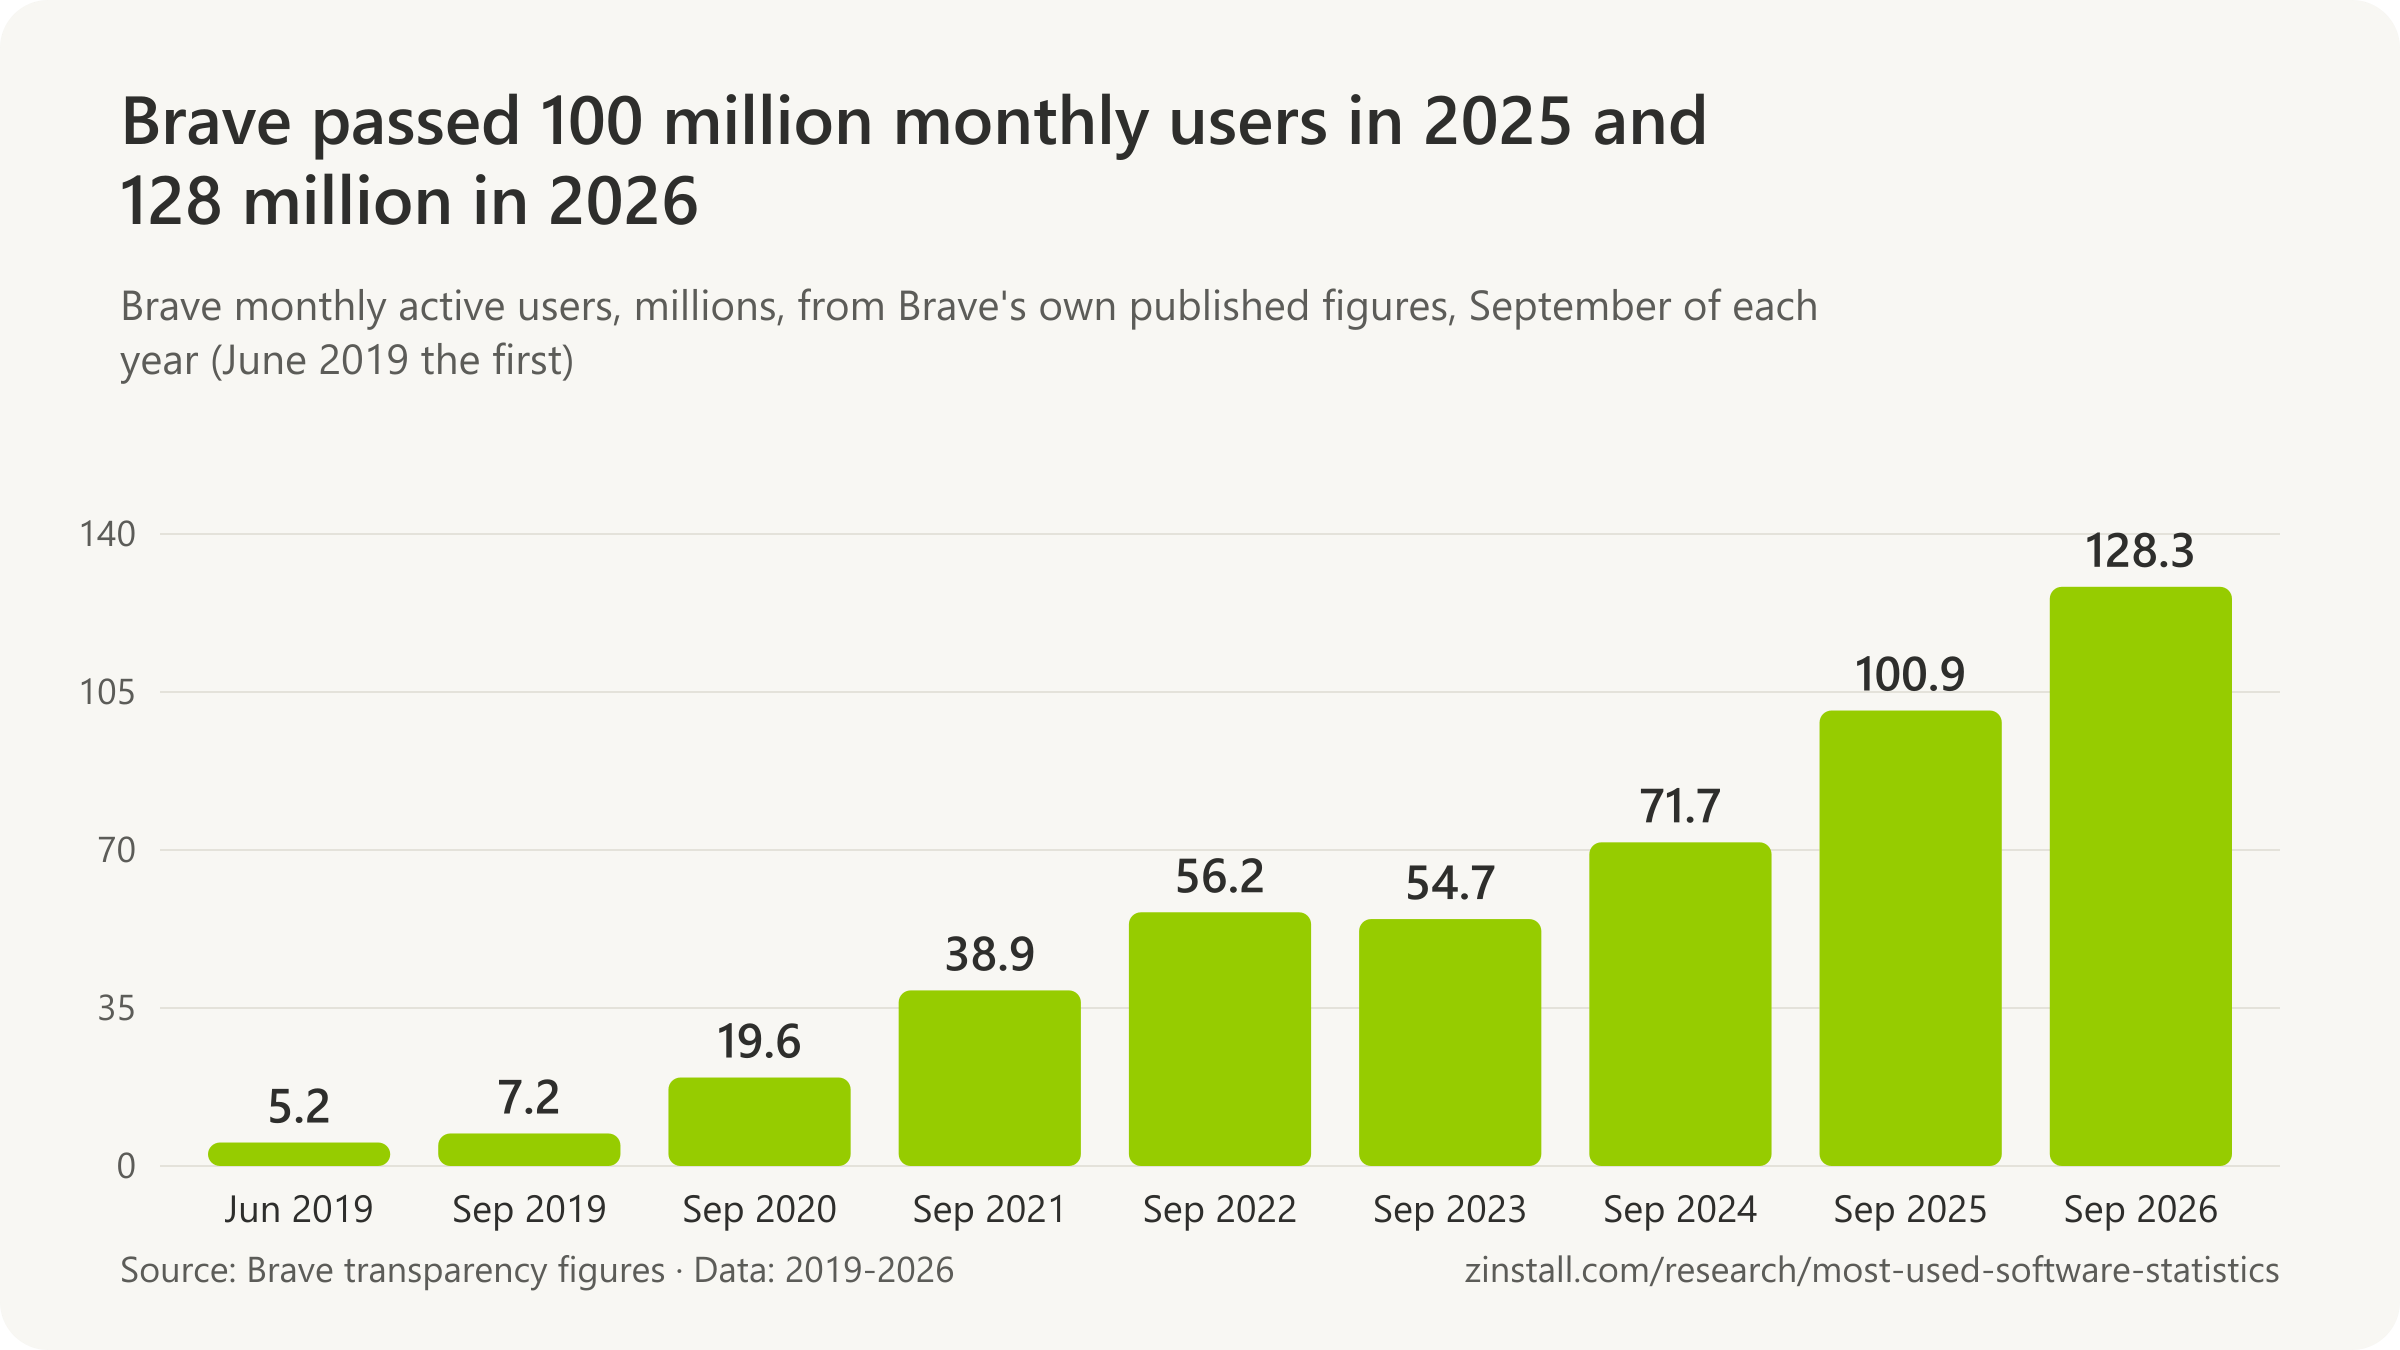
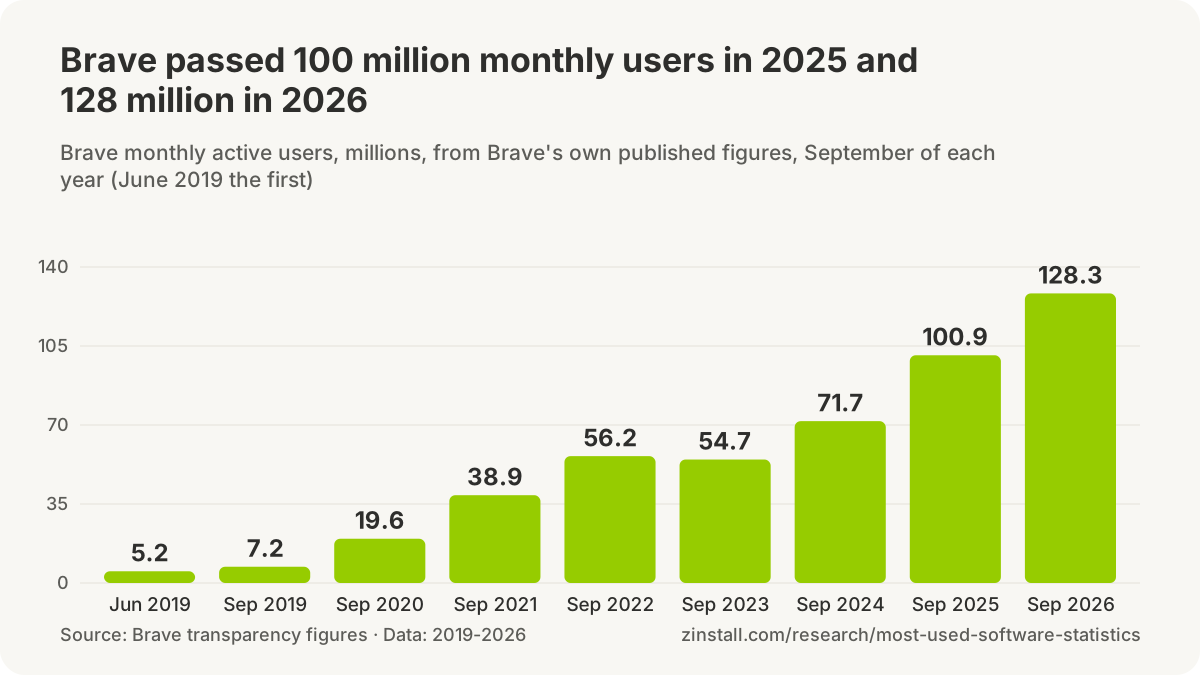
- 128.3 million monthly active users used the Brave browser in September 2026, with 54.6 million daily active users, by Brave's own count (Brave, 2026).
- 54.6 million daily active users used the Brave browser in September 2026, up from 2.15 million in June 2019, by Brave's own count (Brave, 2026).
- 100.9 million monthly active users used Brave in September 2025, the first month above 100 million in Brave's own data, up from 5.2 million in June 2019 (Brave, 2026).
- Over 100 million people use DuckDuckGo, the company's own 'best guess' from its monthly search volume, since it does not track users and publishes no count of browser users (DuckDuckGo, 2026).
- 9 million downloads a month were recorded for DuckDuckGo's browser apps on mobile and desktop, by the company's own count; downloads, not users (DuckDuckGo, 2026).
Desktop operating systems

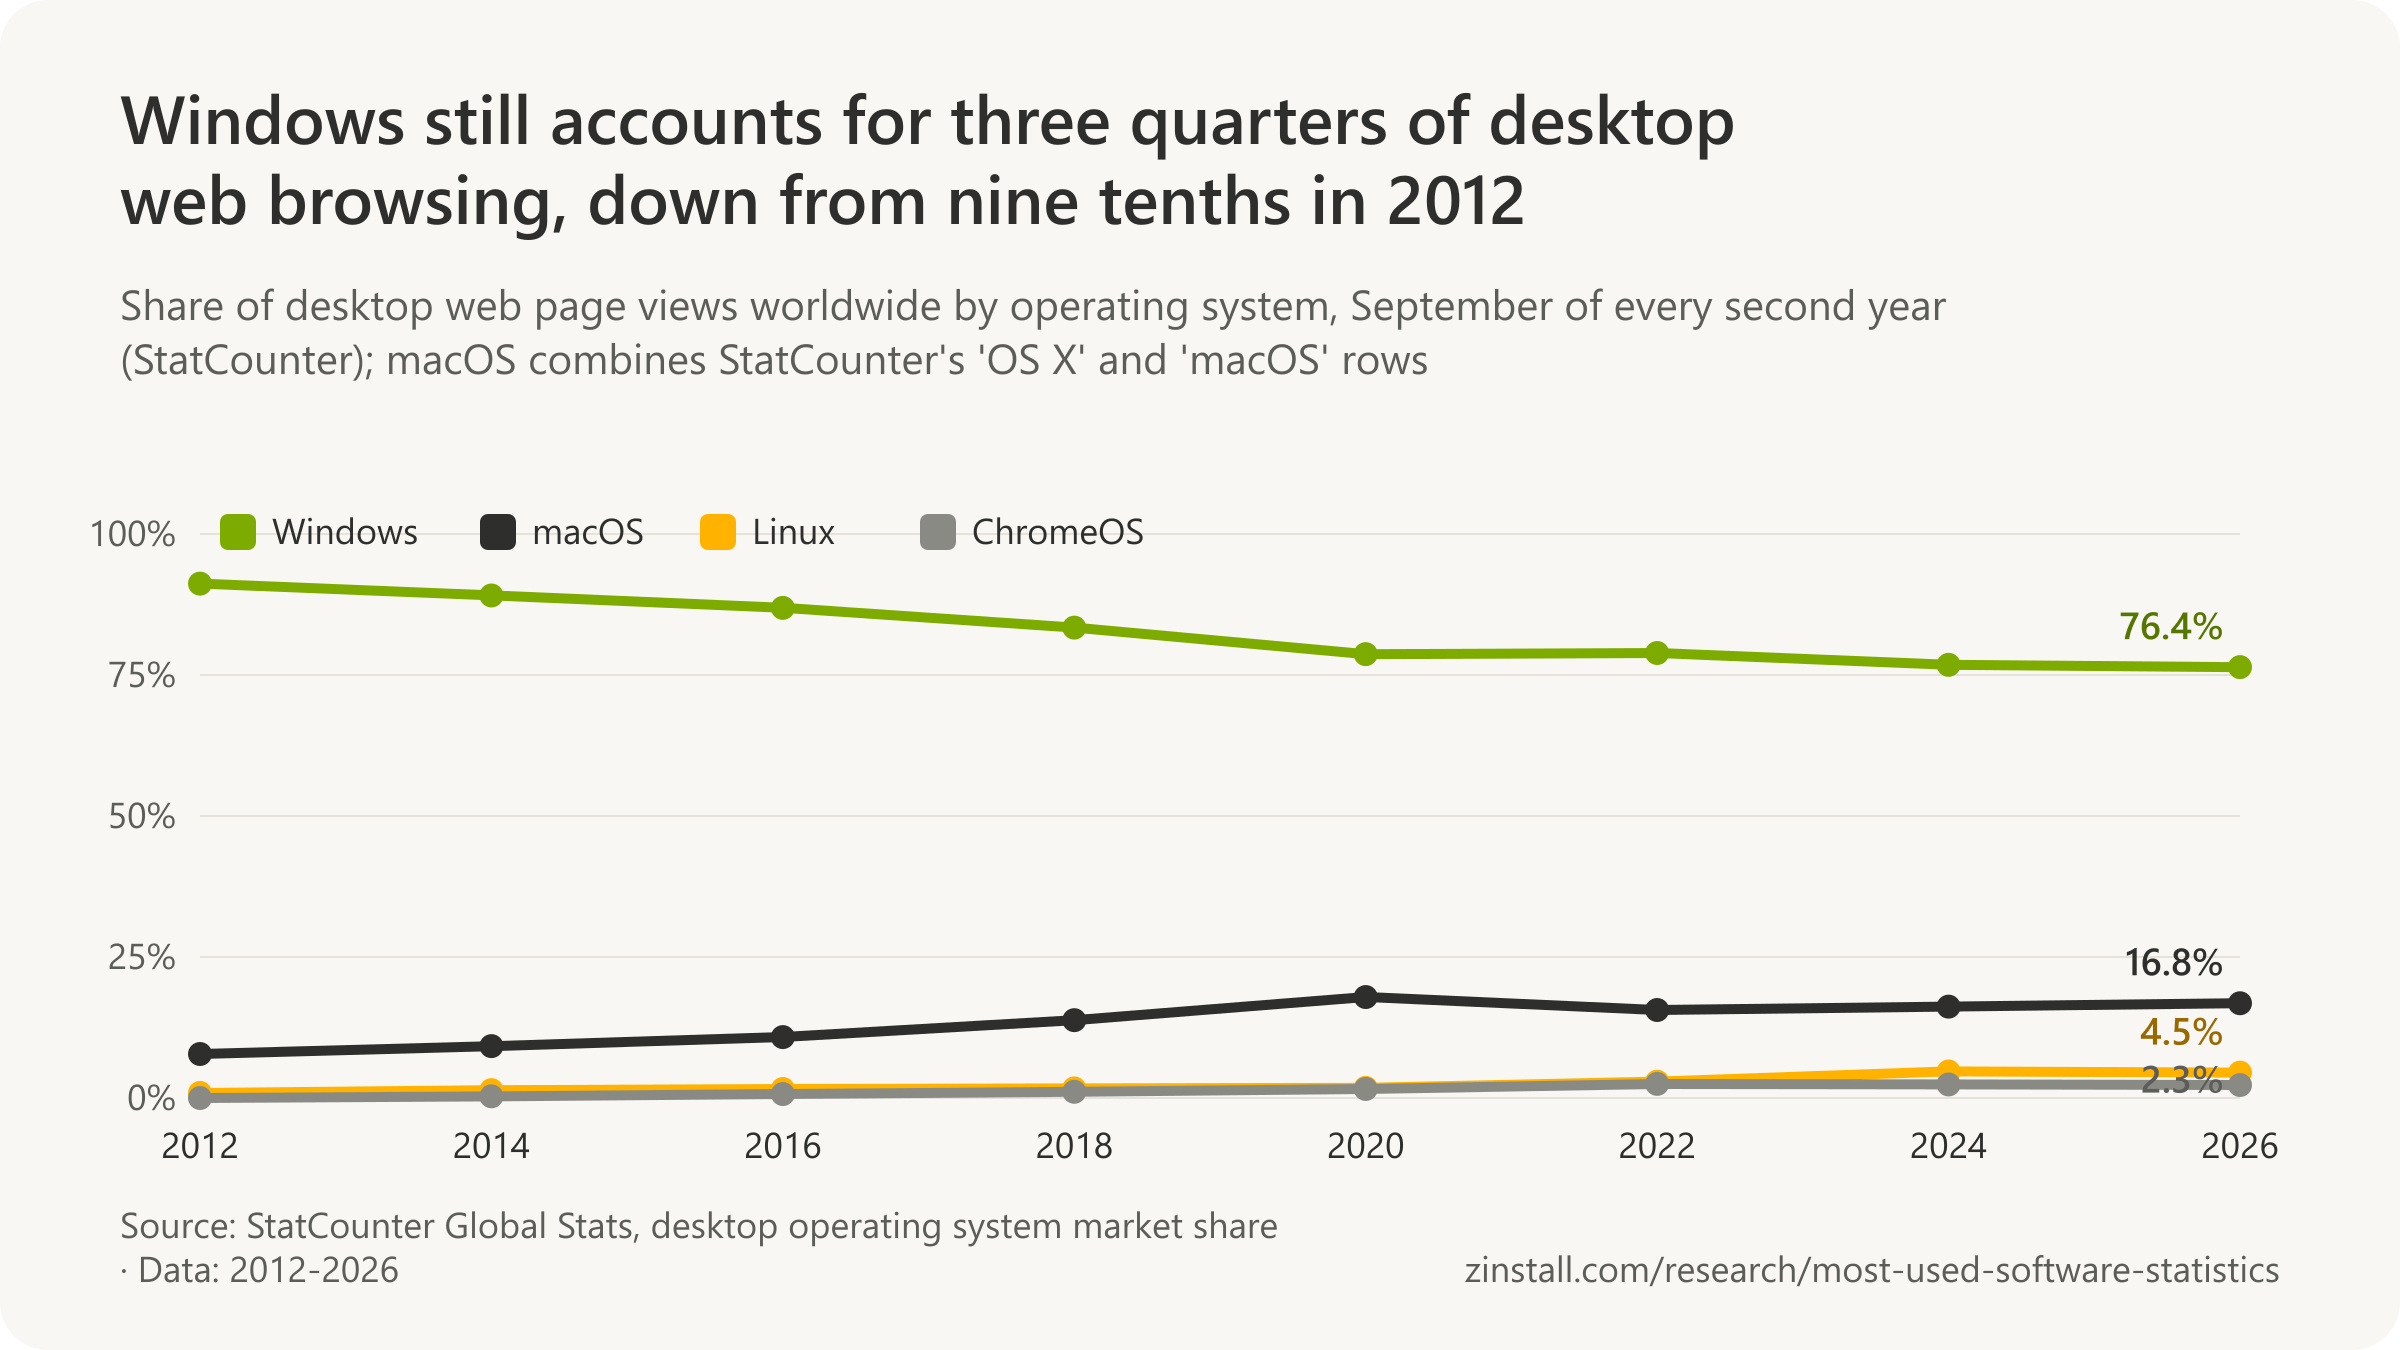
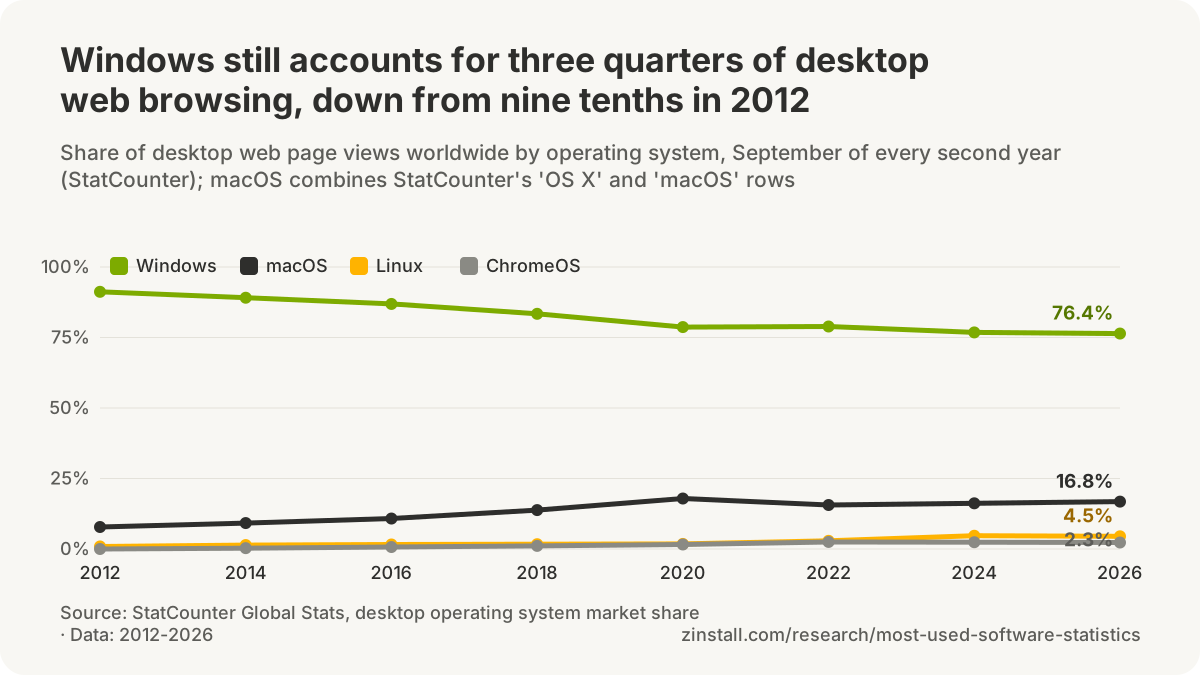
- 76.4% of desktop page views worldwide came from Windows in September 2026, with OS X and macOS together at 16.8% and Linux at 4.5% (StatCounter, 2026).
- 16.8% of desktop web page views worldwide came from Apple's macOS in September 2026, the sum of StatCounter's 'OS X' (10.7%) and 'macOS' (6.1%) rows (StatCounter, 2026).
- 4.5% of desktop page views worldwide came from Linux in September 2026 (StatCounter, 2026).
- 2.3% of desktop page views worldwide came from ChromeOS in September 2026, against 1.8% in September 2025 (StatCounter, 2026).
- 79.9% of desktop page views worldwide came from Windows in September 2025 (StatCounter, 2026).
- 3.8% of desktop page views worldwide came from Linux in September 2025, the month before Windows 10 end of support (StatCounter, 2025).
- 1.8% of desktop page views worldwide came from ChromeOS in September 2025 (StatCounter, 2025).
- Valve describes the Steam Hardware and Software Survey as a monthly survey of what hardware and software its customers use, in which participation is optional and anonymous (Valve, 2026).
- More than 2.5 billion active Apple devices made up Apple's installed base in January 2026, the company said; Safari is the default browser on its iPhones, iPads and Macs, but Apple publishes no Safari user count (Apple, 2026).
- 100 million active Macs made up the Mac installed base in October 2018, Apple CEO Tim Cook said at the company's Brooklyn event, the most recent Mac count Apple has given (TechCrunch, 2018).
- 1.6 billion monthly active Windows devices was the count Satya Nadella gave on Microsoft's fiscal 2026 third-quarter earnings call on 29 April 2026, the highest Windows figure Microsoft has published (Microsoft, 2026).
- 1 billion Windows 11 users were reported by Microsoft CEO Satya Nadella on the fiscal 2026 second-quarter earnings call on 28 January 2026, the first Microsoft-published Windows 11 count (Microsoft, 2026).
- 1.4 billion monthly active devices ran Windows 10 or Windows 11 in Microsoft's fiscal 2022 annual report shareholder letter, the figure most outlets cite for the Windows installed base (Microsoft, 2022).
- 1.4 billion monthly active devices ran Windows worldwide in January 2022, according to Windows chief Panos Panay's blog post after Microsoft's quarterly results (Microsoft, 2022).
- 1 billion monthly active devices ran Windows 10 worldwide in March 2020, Microsoft's first version-level device count for Windows 10 (Microsoft, 2020).
- 15 June 2022 is when the Internet Explorer 11 desktop application went out of support on certain operating systems, including most versions of Windows 10, with IE mode in Microsoft Edge supported through at least 2029 (Microsoft, 2023).
Numbers in circulation
- 3.83 billion Chrome users is Backlinko's estimate for 2025, which its own note says comes from ITU internet-user totals and StatCounter's Chrome share, not from Google (Backlinko, 2026).
- 4.16 billion people using Chrome is Backlinko's April 2026 estimate on its browser-share page, 68.02% of 6.12 billion internet users, two days apart from the same site's 3.83 billion (Backlinko, 2026).
- 3.62 billion Chrome users is DemandSage's headline figure, which is Backlinko's 2024 estimate carried forward; DemandSage cites Statista and Backlinko and says Google has not disclosed its user numbers since 2023 (DemandSage, 2025).
- 3.62 billion users is the Chrome figure Wikipedia's Google Chrome article gives 'as of March 2026', citing DemandSage, whose number traces back to an estimate from StatCounter page-view shares (Wikipedia, 2026).
- More than 3 billion Chrome users is the figure Forbes used in October 2025 with no source given; the last Chrome-only total found from Google was more than two billion active Chrome browsers in 2016 (Forbes, 2025).
- 338 million people using Microsoft Edge is Backlinko's April 2026 estimate, its 5.53% share of page views applied to 6.12 billion internet users, not a Microsoft figure (Backlinko, 2026).
- 1.04 billion people using Safari is Backlinko's April 2026 estimate, Safari's 17.04% share of page views applied to 6.12 billion internet users, not an Apple figure (Backlinko, 2026).
- 138 million people using Firefox is Backlinko's April 2026 estimate from Firefox's 2.26% share of page views, well below Mozilla's own count of about 195 million monthly active desktop and mobile clients at that time (Backlinko, 2026).
Sources: StatCounter (2025, 2026); Cloudflare (2023-2026); Google (2012-2025); Alphabet; 9to5Google; Microsoft (2020-2026); Windows Central (2017, 2021); Mozilla (2020-2026); Opera (2020-2026); Brave (2026); DuckDuckGo (2026); Valve; Apple; TechCrunch; Atlas VPN; Backlinko (2026); DemandSage; Wikipedia; Forbes
How many people use Teams, Zoom, Slack and Outlook?
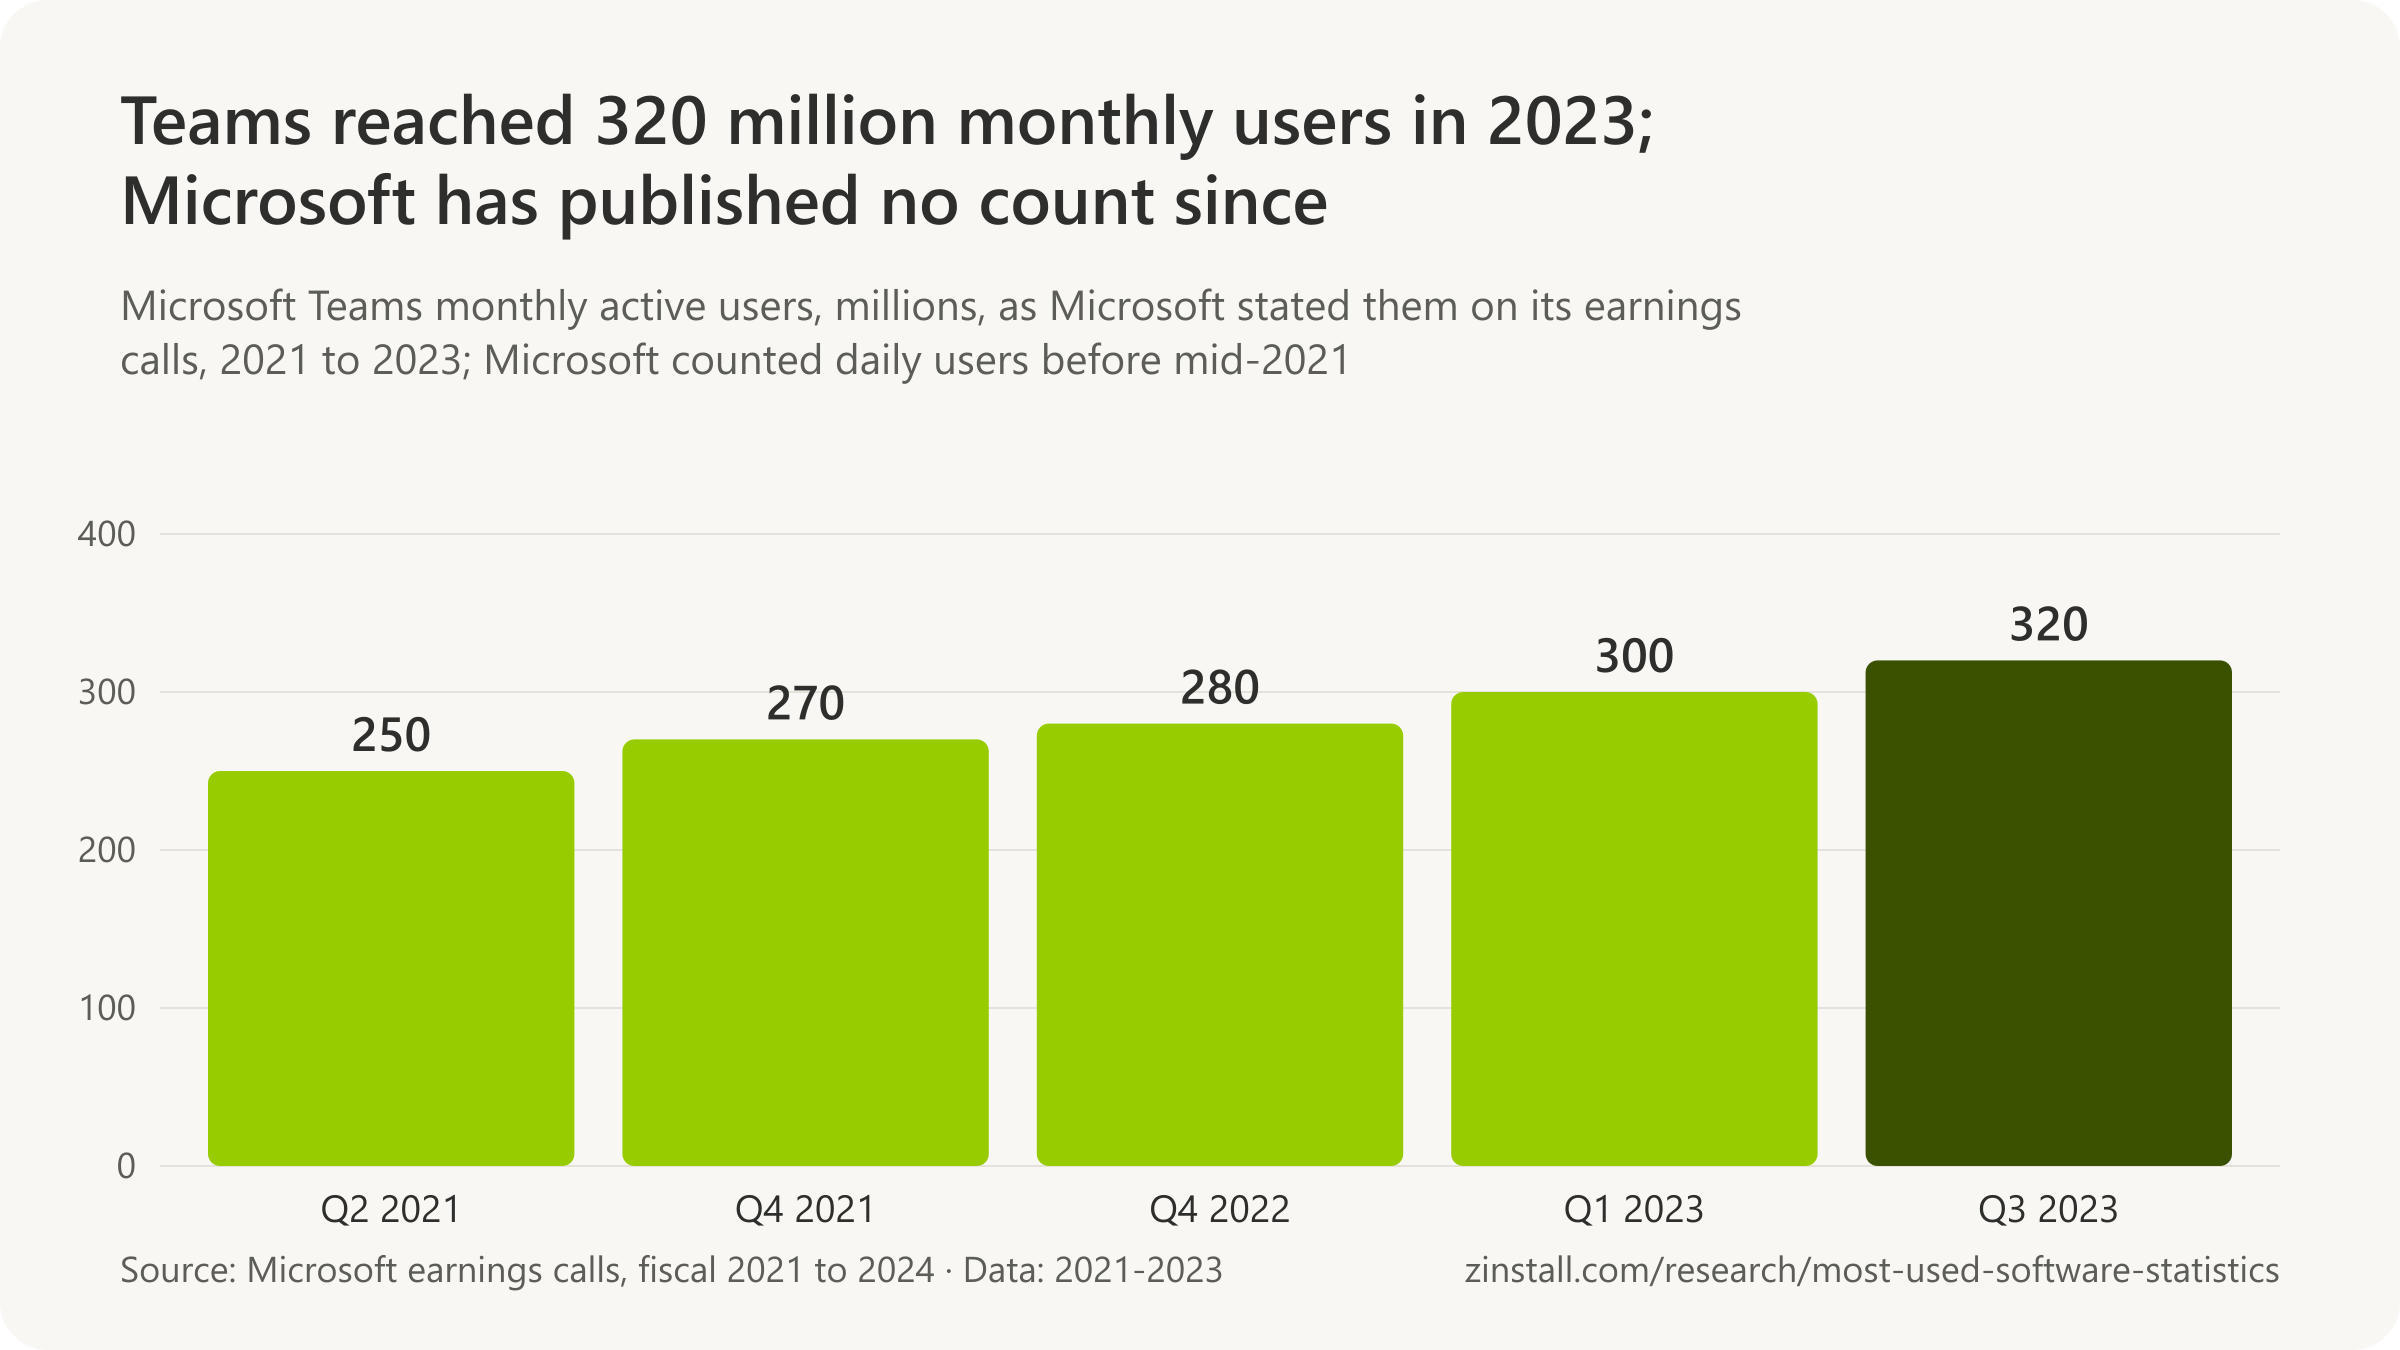
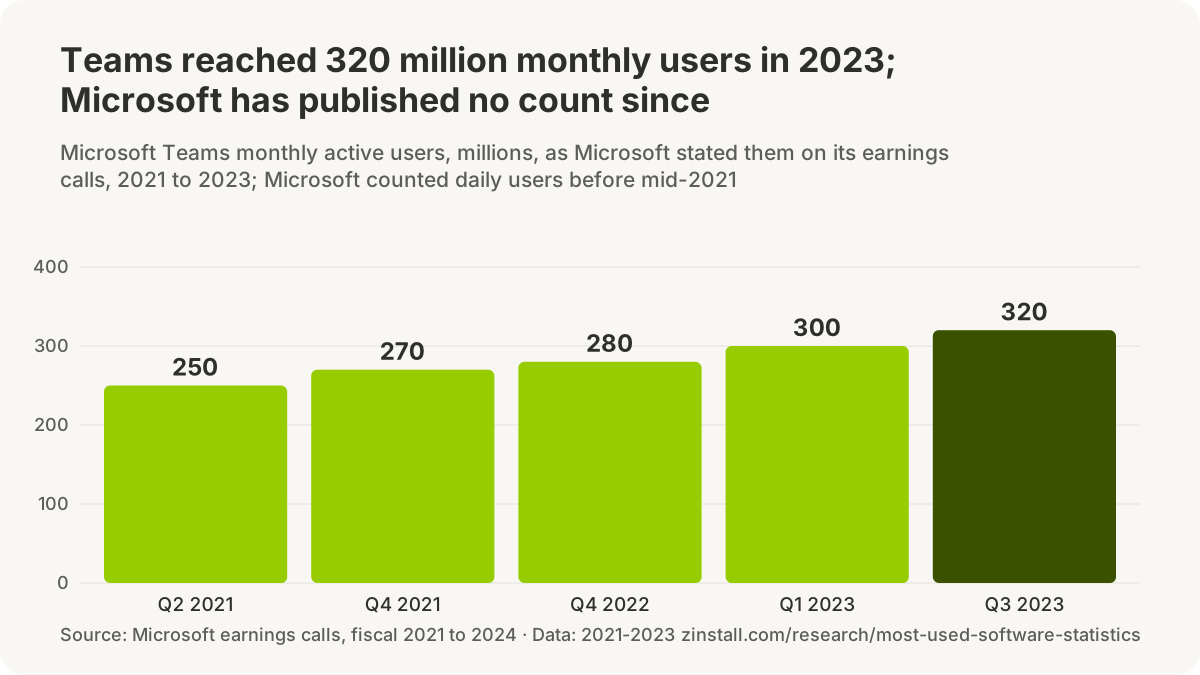
Microsoft Teams had more than 320 million monthly users in 2023, the last count published (Microsoft, 2023).

- Daily Teams users grew from 13 million in July 2019 to more than 145 million in April 2021.
- Zoom's peak of more than 300 million in April 2020 counted daily meeting participants, not people.
- Slack's last user count, in 2019, was more than 12 million daily users.
- Thunderbird ran on 15.3 million installations a month in October 2026.
- Skype was retired on 5 May 2025.
| Email client | Share of opens |
|---|---|
| Apple (Mail on iPhone, iPad and Mac) | 62.3% |
| Gmail | 27.0% |
| Outlook (desktop) | 5.8% |
| Yahoo | 2.6% |
| Outlook.com | 0.4% |
| Thunderbird | 0.2% |
Sources: Microsoft (2021-2026); Zoom Video Communications; Slack Technologies; MZLA Technologies; Litmus
Moving these programs to a new computer: Outlook · Thunderbird
More statistics (147)
Meeting and chat apps have been counted in many measures: organisations, daily users, monthly users, meeting participants and paid seats. Several makers stopped publishing user counts after 2021. Email clients are measured by the opens an email-testing service tracks, not by users.
Microsoft Teams

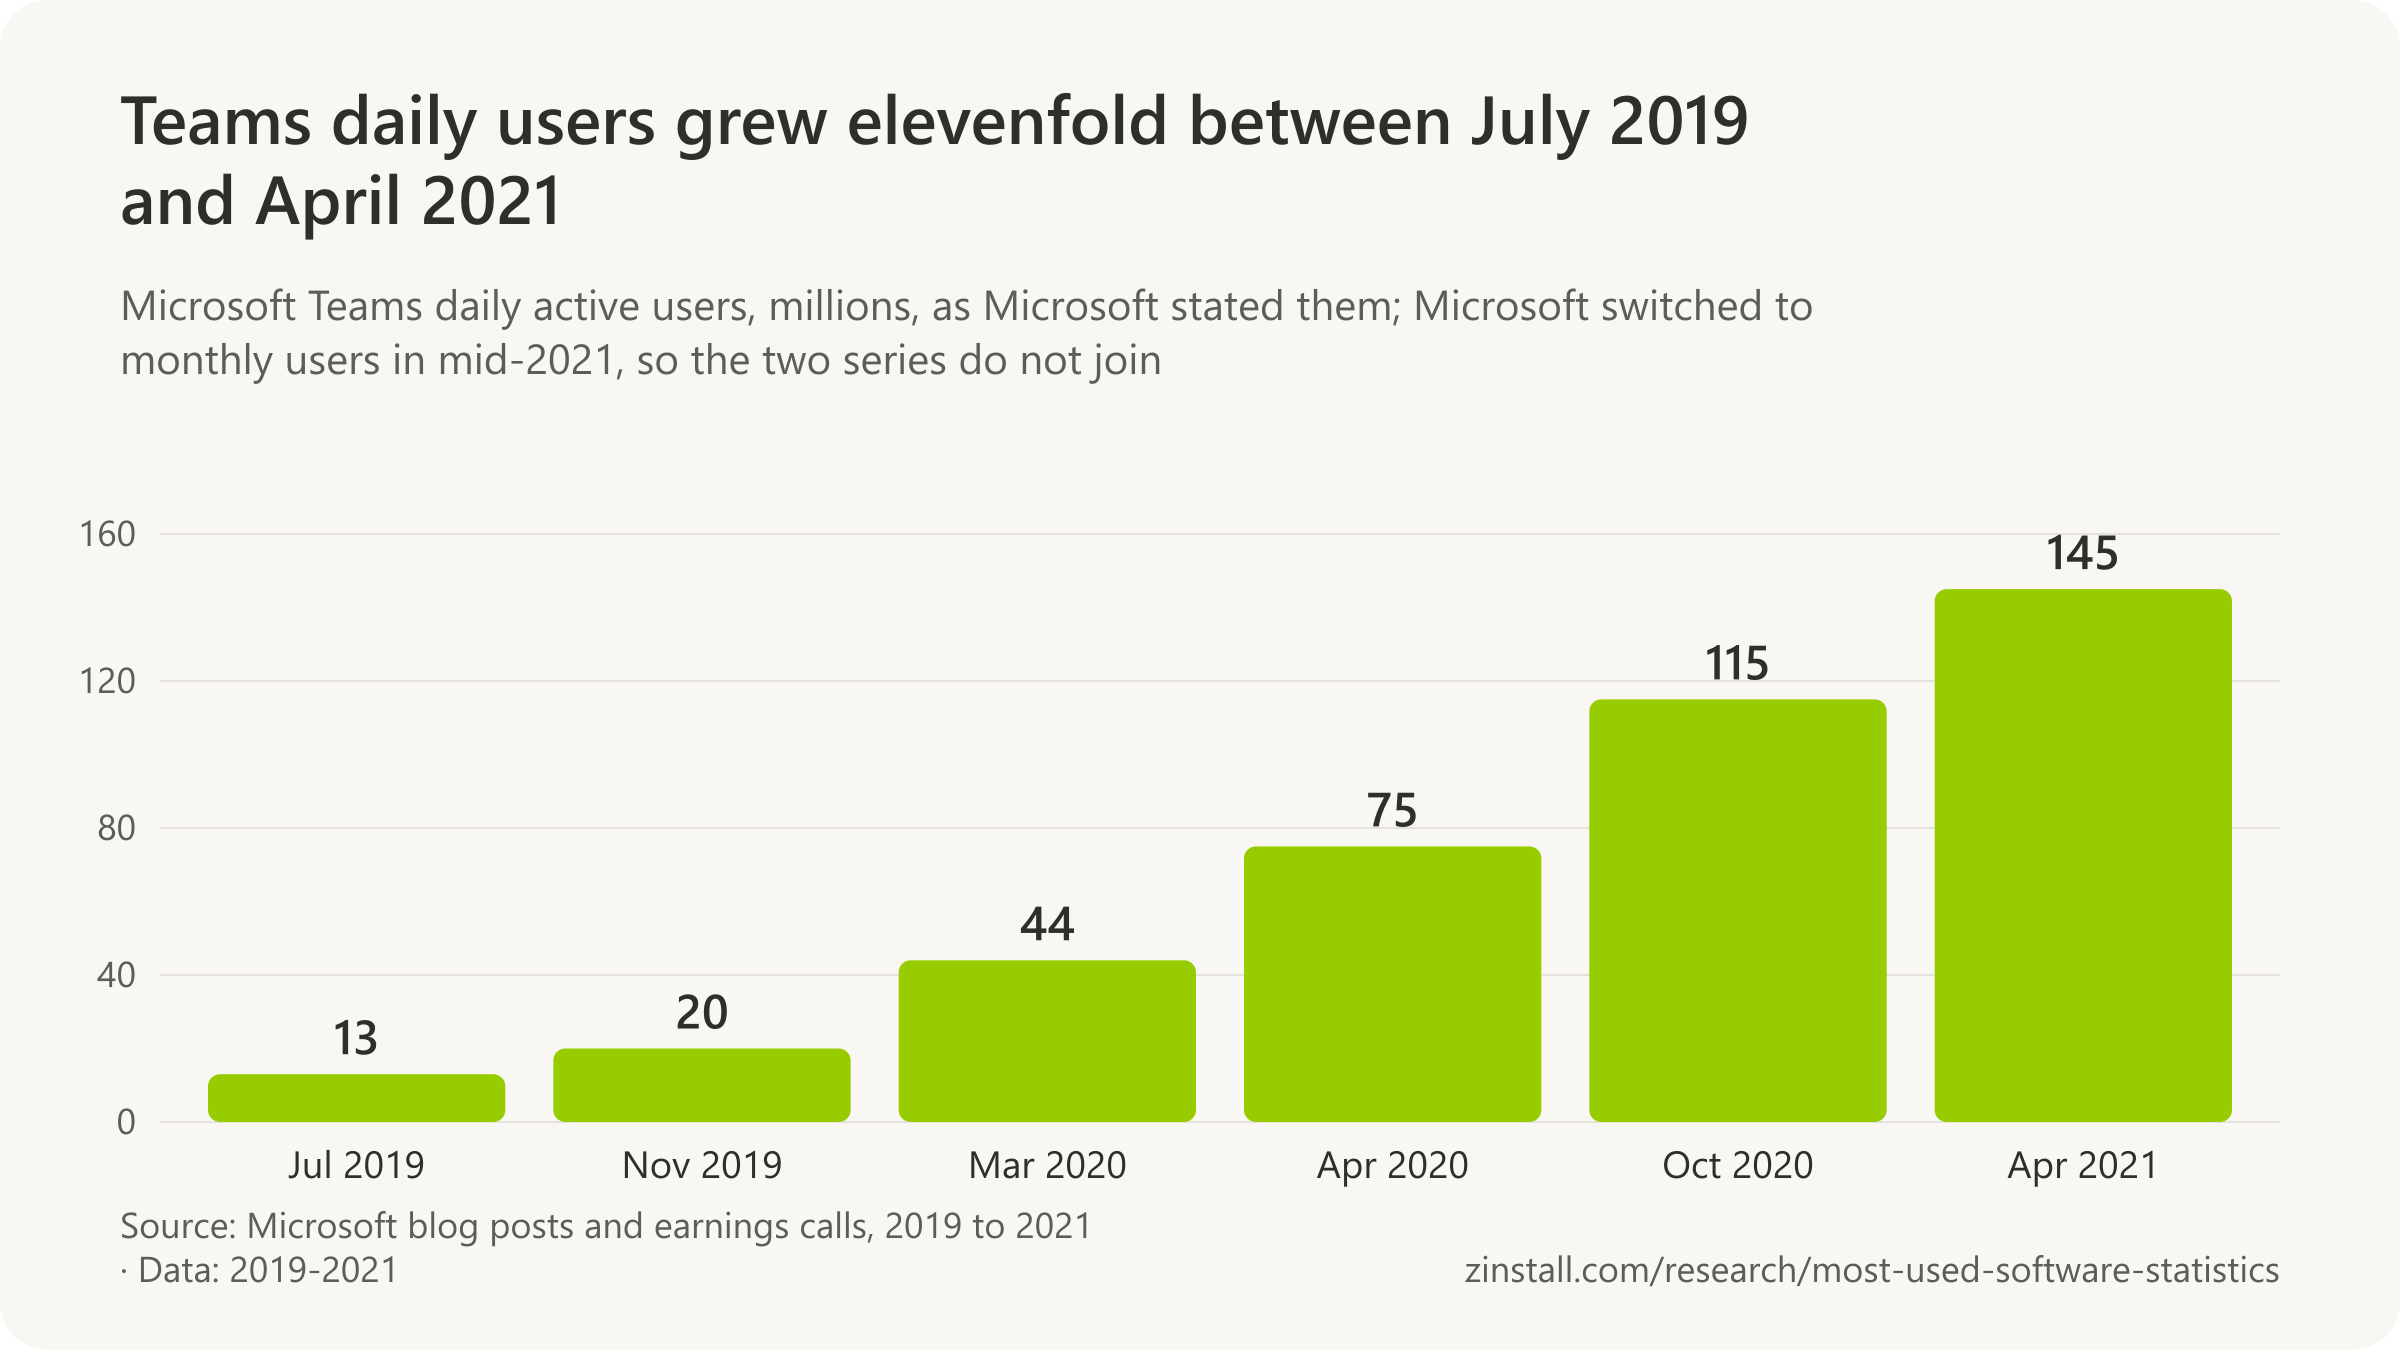
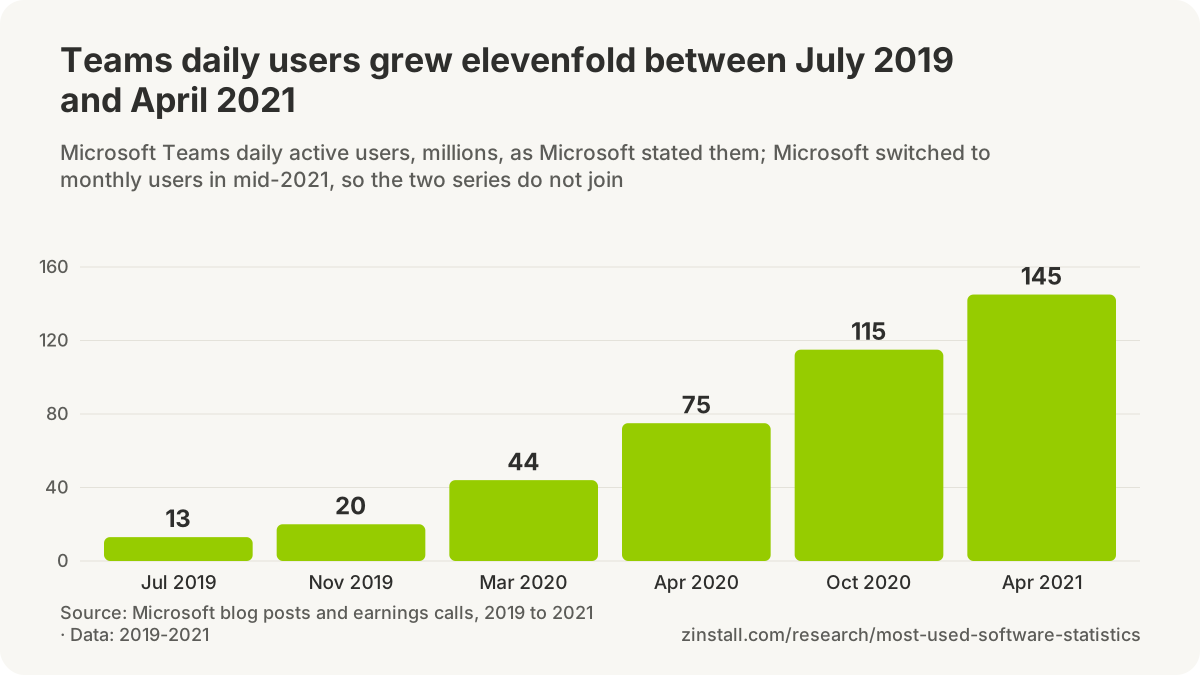
- More than 50,000 customer organisations were using Microsoft Teams in April 2017, the quarter Microsoft made it broadly available to Office 365 customers in 181 markets, Microsoft said on its earnings call (Microsoft, 2017).
- More than 125,000 organisations were using Microsoft Teams in September 2017, six months after its launch, Microsoft said at its Ignite conference (Microsoft, 2017).
- More than 200,000 organisations in 181 markets were using Microsoft Teams in April 2018, one year after launch, Microsoft said on its earnings call (Microsoft, 2018).
- 329,000 organisations, including 87 of the Fortune 100, were using Microsoft Teams in October 2018, Microsoft said on its earnings call (Microsoft, 2018).
- More than 420,000 organisations, including 89 of the Fortune 100, were using Microsoft Teams in January 2019, the last organisation count Microsoft gave before it switched to daily users (Microsoft, 2019).
- More than 13 million people used Microsoft Teams each day (daily active users) in July 2019, the first user count Microsoft published for Teams (Microsoft, 2019).
- More than 19 million people used Microsoft Teams each week (weekly active users) in July 2019, the only weekly figure Microsoft has given for Teams (Microsoft, 2019).
- More than 20 million people used Microsoft Teams each day (daily active users) by November 2019, Microsoft said, repeating the figure on its January 2020 earnings call (Microsoft, 2020).
- More than 44 million people used Microsoft Teams each day (daily users) in March 2020, up 12 million in one week as offices closed for the pandemic, Microsoft said (Microsoft, 2020).
- More than 75 million people used Microsoft Teams each day (daily active users) in April 2020, Microsoft said on its earnings call, up from 44 million six weeks earlier (Microsoft, 2020).
- More than 200 million meeting participants joined Microsoft Teams meetings in a single day in April 2020, generating more than 4.1 billion meeting minutes, Microsoft said; participants are counted per meeting, not as people (Microsoft, 2020).
- More than 115 million people used Microsoft Teams each day (daily active users) in October 2020, Microsoft said on its earnings call (Microsoft, 2020).
- Nearly 60 million people used Microsoft Teams each day on mobile devices alone (mobile daily active users) in January 2021, Microsoft said on its earnings call (Microsoft, 2021).
- More than 145 million people used Microsoft Teams each day (daily active users) in April 2021, almost double a year earlier and the last daily figure Microsoft gave (Microsoft, 2021).
- Nearly 250 million people used Microsoft Teams each month (monthly active users) in the quarter to June 2021, Microsoft's first monthly figure for Teams (Microsoft, 2021).
- Nearly 80 million people used Teams Phone, Microsoft Teams' calling feature, each month (monthly active users) in the quarter to June 2021, Microsoft said (Microsoft, 2021).
- More than 270 million people used Microsoft Teams each month (monthly active users) in the quarter to December 2021, Microsoft said on its January 2022 earnings call (Microsoft, 2022).
- More than 280 million people used Microsoft Teams each month (monthly active users) in the quarter to December 2022, Microsoft said on its January 2023 earnings call (Microsoft, 2023).
- More than 300 million people used Microsoft Teams each month (monthly active users) in the quarter to March 2023, Microsoft said on its April 2023 earnings call (Microsoft, 2023).
- More than 320 million people used Microsoft Teams each month (monthly active users) in the quarter to September 2023, the last Teams user count Microsoft has published (Microsoft, 2023).
- No Microsoft Teams user count has been published since October 2023: Microsoft's eleven earnings calls from January 2024 to July 2026 describe Teams as used by 'hundreds of millions of people' without a figure (Microsoft, 2026).
- More than 20 million people made phone-network calls with Teams Phone (PSTN users) in April 2024, up nearly 30% in a year, Microsoft said (Microsoft, 2024).
- More than 12 million people made phone-network calls with Teams Phone (PSTN users) in July 2022, nearly double a year earlier, Microsoft said (Microsoft, 2022).
- More than 17 million people made phone-network calls with Teams Phone (PSTN users) in July 2023, up 45% in a year, Microsoft said (Microsoft, 2023).
- Skype would be retired in May 2025 so Microsoft could focus on Microsoft Teams (free), Microsoft announced on 28 February 2025, keeping it available until 5 May 2025 (Microsoft, 2025).
Zoom

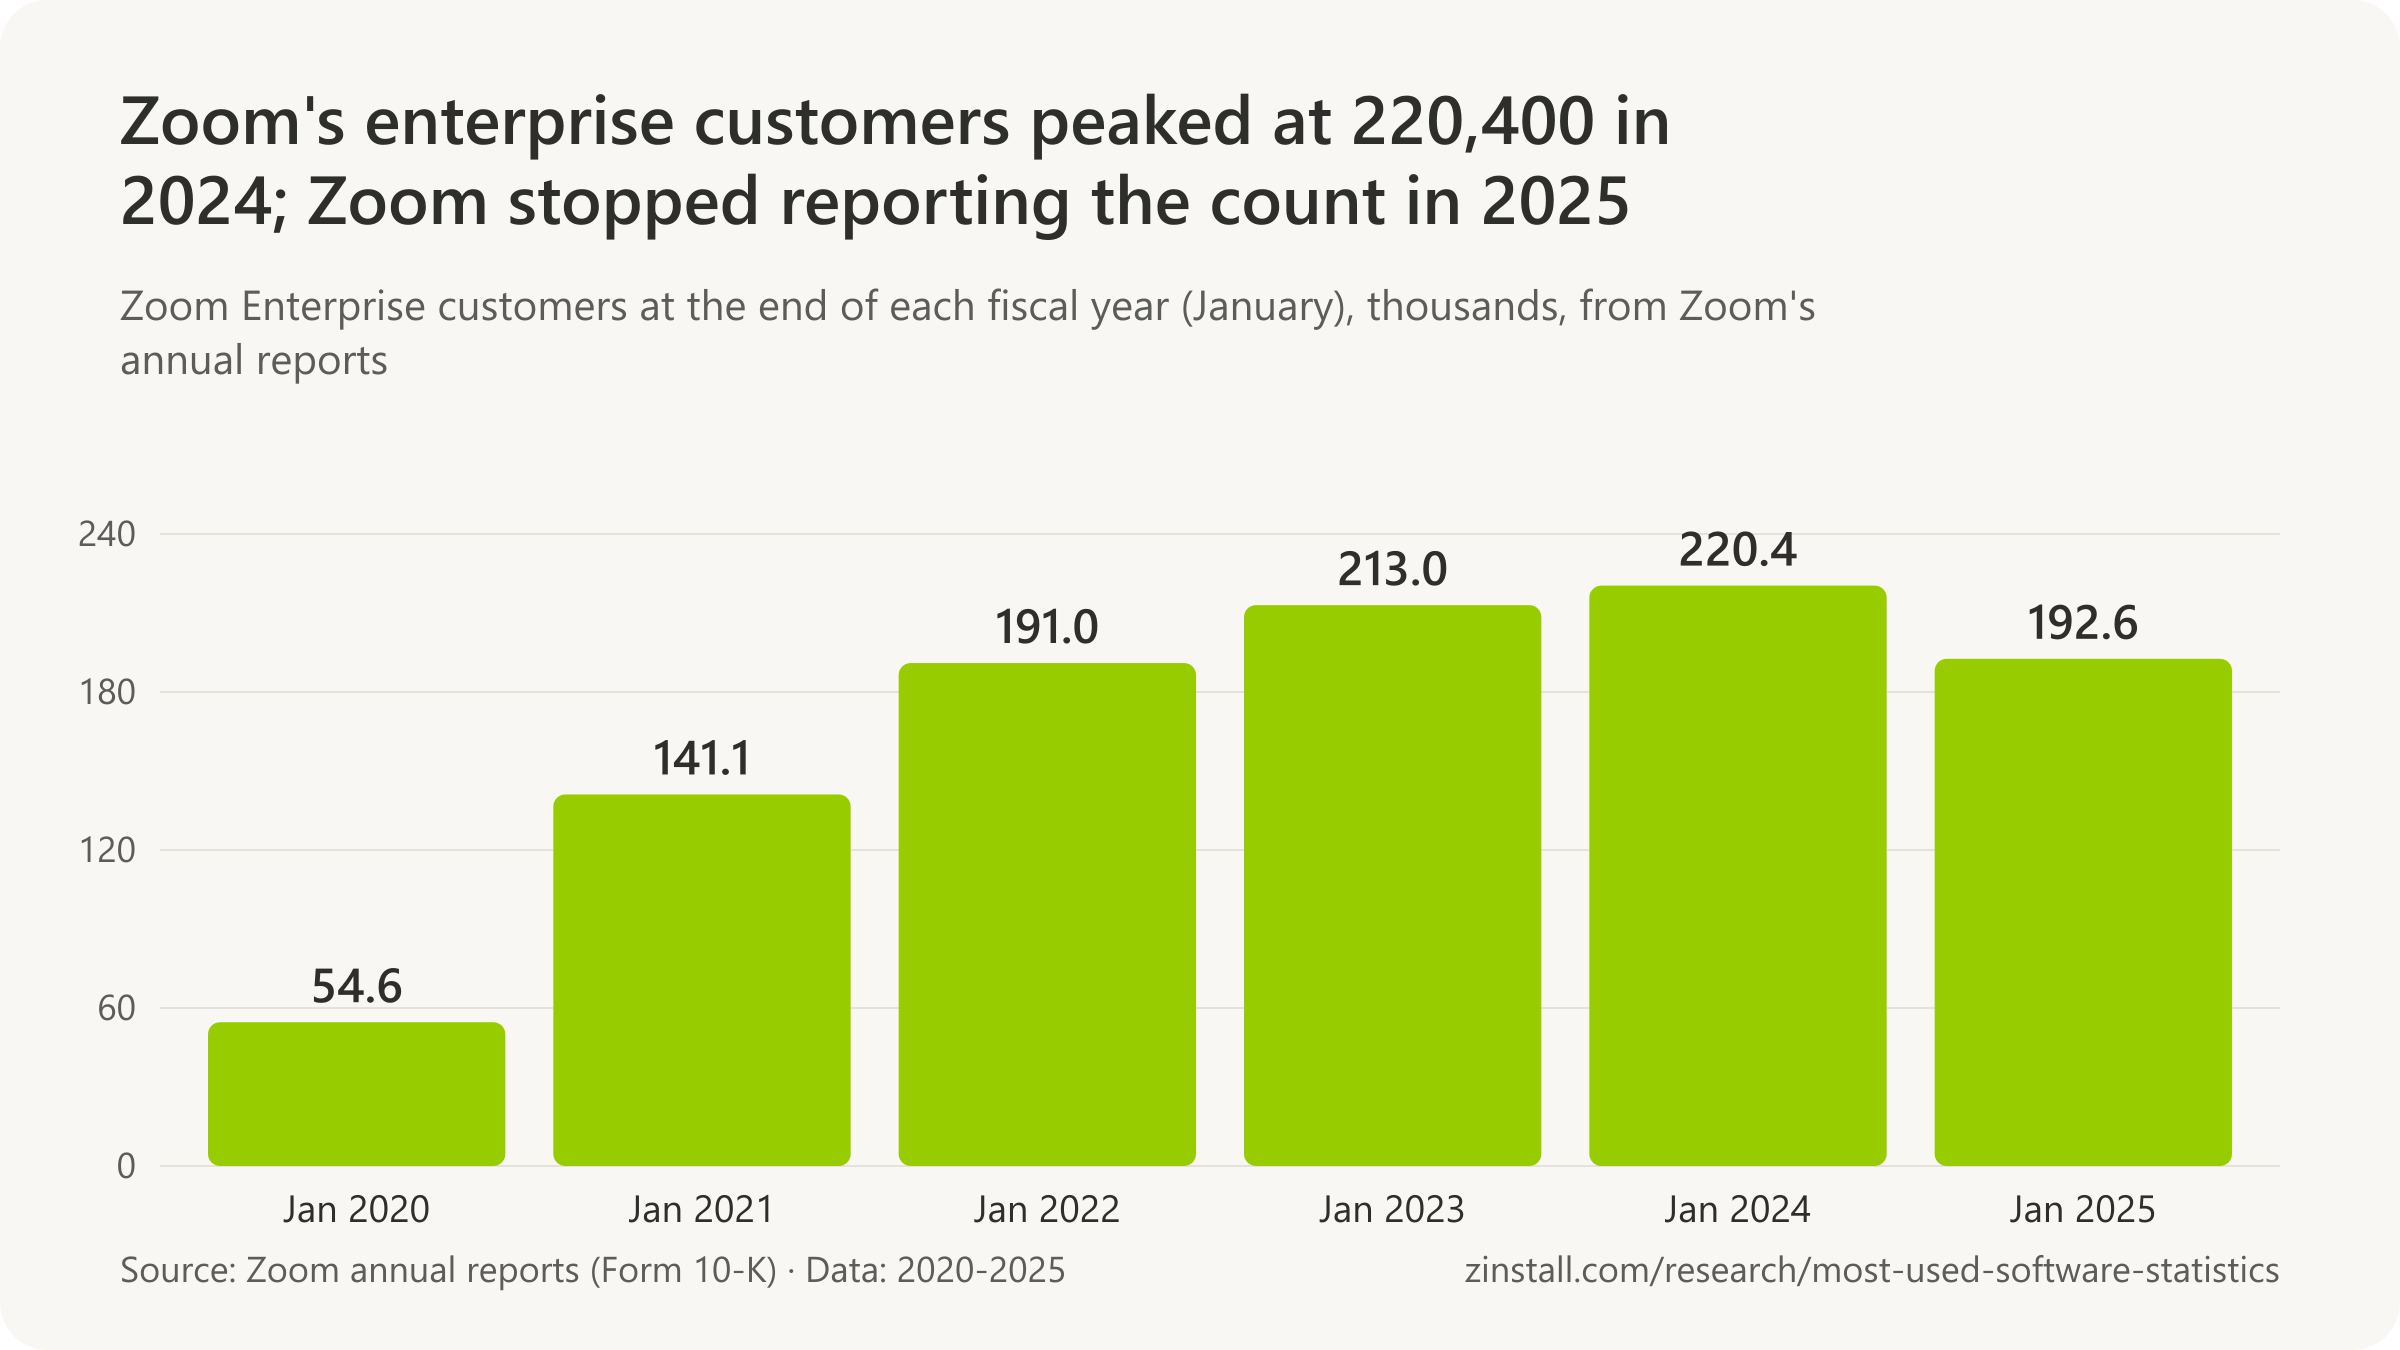
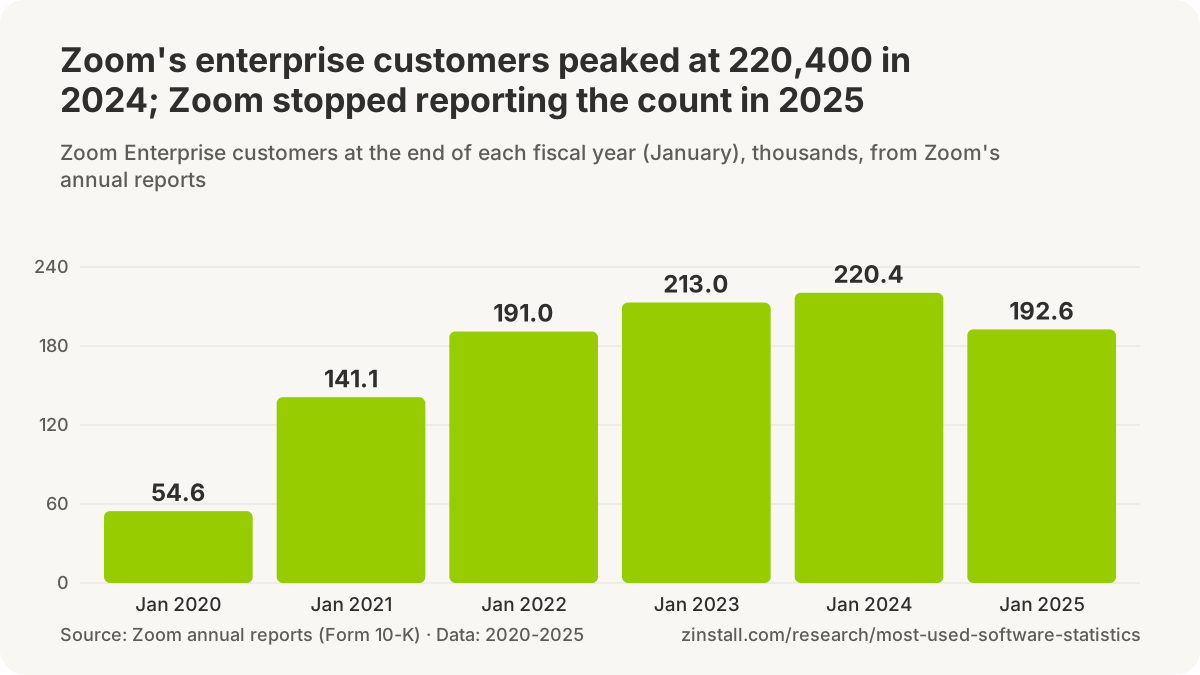
- About 10 million daily meeting participants (free and paid) was Zoom's peak at the end of December 2019, before the pandemic, Zoom founder Eric Yuan wrote; participants are counted per meeting, not as unique people (Zoom, 2020).
- More than 200 million daily meeting participants (free and paid) were reached on Zoom in March 2020, up from about 10 million in December 2019, Eric Yuan wrote (Zoom, 2020).
- More than 300 million daily meeting participants used Zoom in April 2020, up from about 10 million in December 2019, Zoom stated in a January 2021 SEC filing; it is a count of meeting joins, not of people, and Zoom has published no daily or monthly user figure (Zoom, 2021).
- Zoom added an editor's note on 29 April 2020 admitting that its 22 April 2020 post 'originally referred to meeting participants as users and people', calling it an oversight corrected on 23 April (Zoom, 2020).
- Zoom admitted it did not have 300 million daily active users after The Verge found it had quietly edited its 22 April 2020 post; a meeting participant is counted once per meeting, a daily active user once per day (The Verge, 2020).
- More than 3.5 trillion annualised meeting minutes was Zoom's run rate in October 2020 (the month's minutes times 12), up from 5 billion minutes a month in February 2019, Zoom stated in an SEC filing (Zoom, 2021).
- More than 5 billion meeting minutes a month were held on Zoom in February 2019 (about 60 billion a year), the milestone in its IPO filing a year before the pandemic (Zoom, 2019).
- About 25,800 Zoom customers had more than 10 employees at the end of January 2018, by Zoom's count in its annual report (Zoom, 2020).
- About 50,800 Zoom customers had more than 10 employees at the end of January 2019, by Zoom's count (Zoom, 2020).
- About 81,900 Zoom customers had more than 10 employees at the end of January 2020, just before the pandemic, by Zoom's count (Zoom, 2020).
- About 467,100 Zoom customers had more than 10 employees at the end of January 2021, almost six times the 81,900 of a year earlier (Zoom, 2021).
- About 509,800 Zoom customers had more than 10 employees at the end of January 2022, the last time Zoom reported this measure (Zoom, 2022).
- About 54,600 Enterprise customers (business units served by Zoom's sales team or partners) used Zoom at the end of January 2020, Zoom said when it introduced the measure (Zoom, 2022).
- About 141,100 Enterprise customers used Zoom at the end of January 2021, by Zoom's count (Zoom, 2022).
- About 191,000 Enterprise customers used Zoom at the end of January 2022, by Zoom's count (Zoom, 2022).
- About 213,000 Enterprise customers used Zoom at the end of January 2023, by Zoom's count (Zoom, 2024).
- About 220,400 Enterprise customers used Zoom at the end of January 2024, the highest count it reported (Zoom, 2024).
- About 192,600 Enterprise customers used Zoom at the end of January 2025, after it moved 26,800 smaller ones to its online channel, the last count before Zoom stopped reporting the measure (Zoom, 2025).
- Zoom stopped reporting its number of Enterprise customers from the quarter to April 2025, its annual report said; it now reports only the number of customers paying more than $100,000 a year (Zoom, 2025).
- 4,625 Zoom customers each paid more than $100,000 in the twelve months to July 2026, up 8.2% in a year, the only customer count Zoom still reports (Zoom, 2026).
- 4,468 Zoom customers each paid more than $100,000 in the twelve months to January 2026, against 4,088 a year earlier (Zoom, 2026).
- More than 10 million seats of Zoom Phone, Zoom's cloud phone system, were in use worldwide in October 2025, six years after its 2019 launch, Zoom said (Zoom, 2025).
Slack

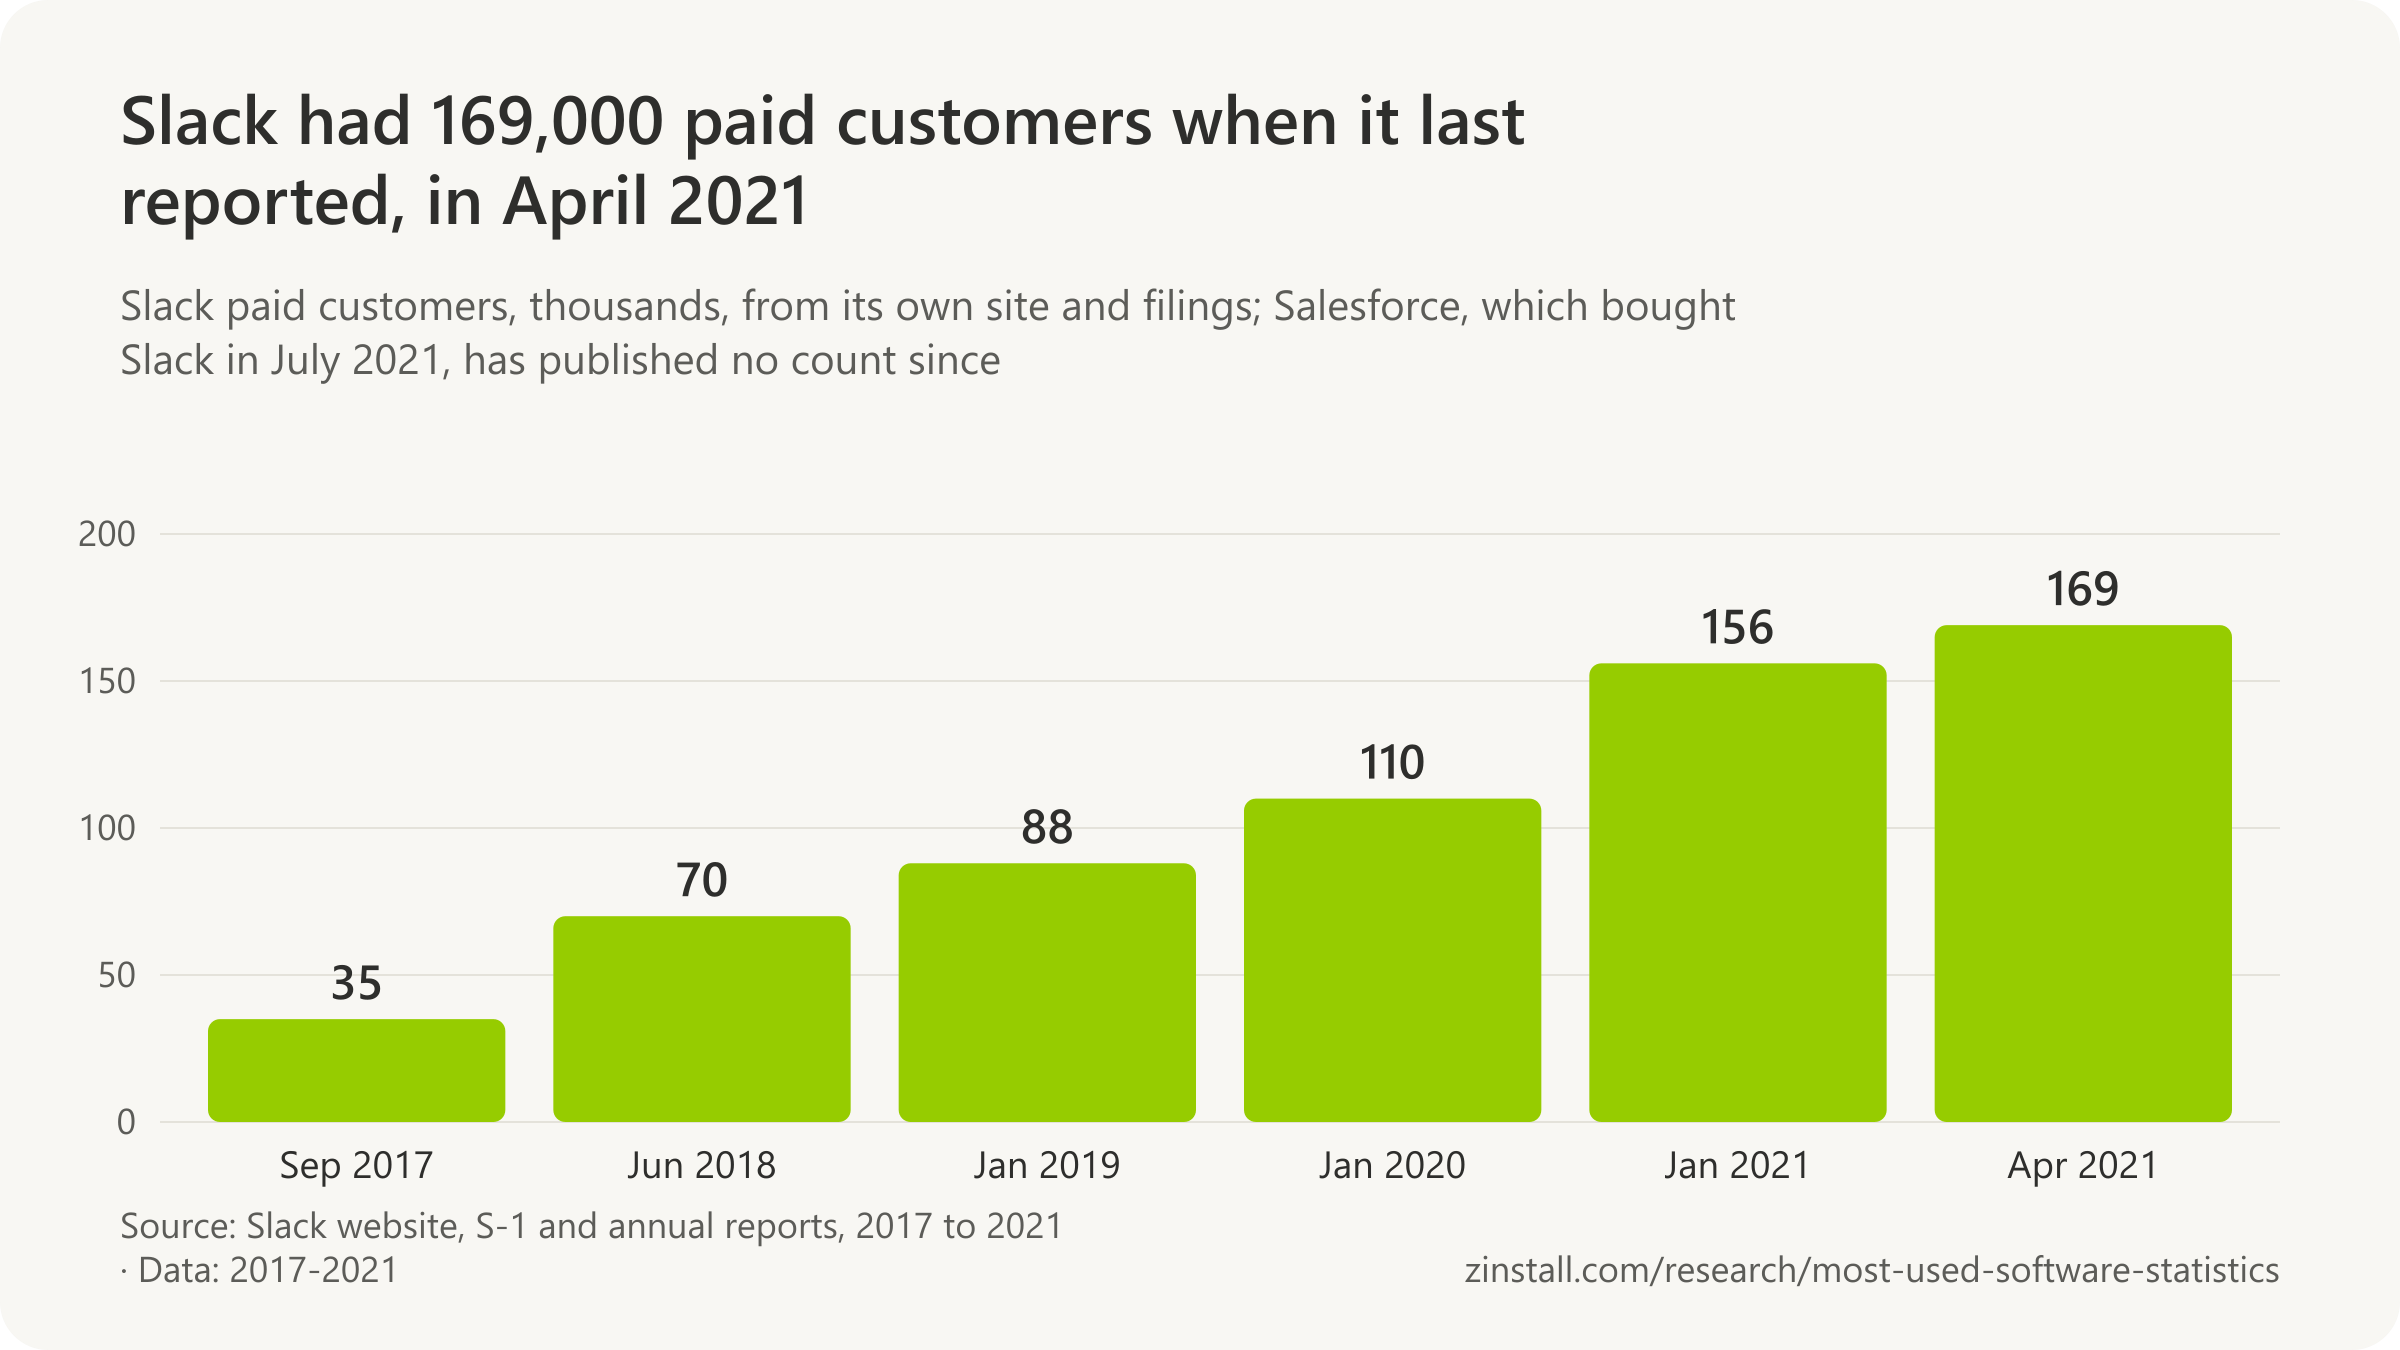
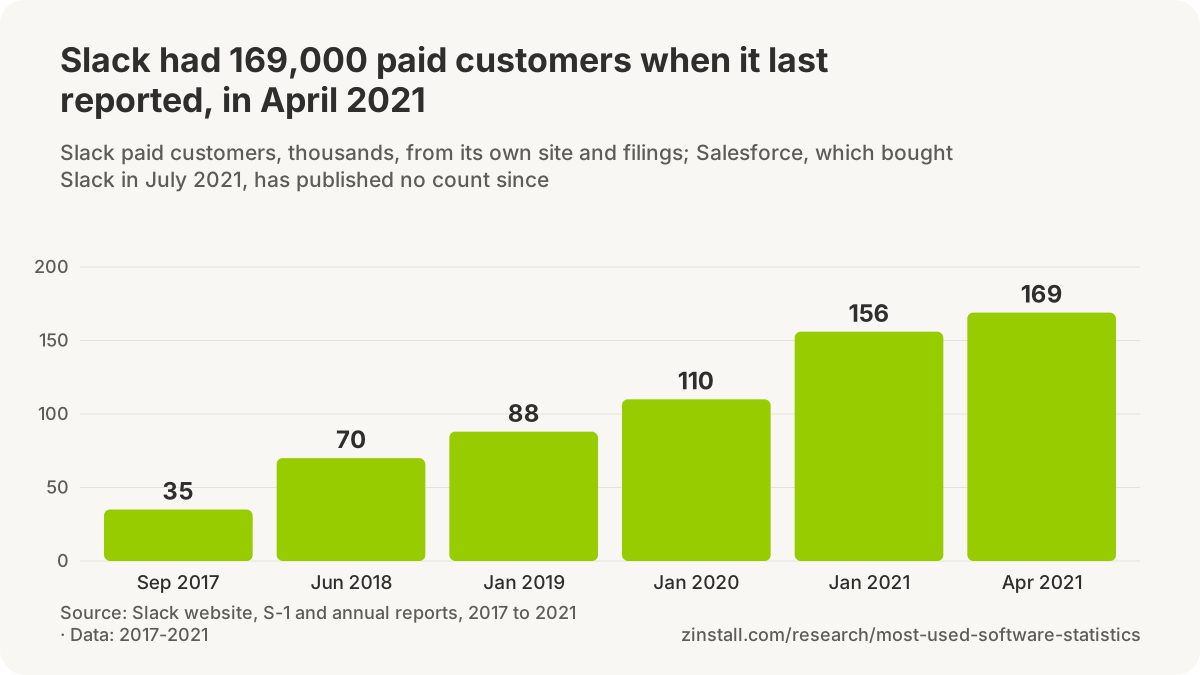
- More than 10 million people used Slack each day (daily active users) in the three months to January 2019, Slack said in its stock market listing filing (Slack, 2019).
- More than 88,000 organisations paid for Slack (paid customers with three or more paid users) at the end of January 2019, among more than 600,000 organisations using it (Slack, 2019).
- More than 12 million people used Slack each day (daily active users) in September 2019, up about 37% in a year, the last daily-user figure Slack published (Slack, 2019).
- More than 6 million paid seats of Slack were in use in September 2019, Slack said, against more than 12 million daily users on free and paid plans (Slack, 2019).
- 12.5 million people were connected to Slack at the same time on 25 March 2020, up from 10 million on 10 March as offices closed, Slack said; this counts simultaneous connections, a different measure from daily users (Slack, 2020).
- More than 110,000 organisations paid for Slack at the end of January 2020, among more than 660,000 organisations using it (Slack, 2020).
- More than 156,000 organisations paid for Slack at the end of January 2021, among more than 756,000 organisations using it (Slack, 2021).
- More than 169,000 organisations paid for Slack at the end of April 2021, up 39% in a year, Slack's last count as an independent company before Salesforce bought it (Slack, 2021).
- More than 200,000 paid customers is the figure on Slack's About page under Salesforce, unchanged from November 2022 to October 2026, alongside '77 of the Fortune 100' (Slack, 2026).
- No Slack user or customer count appears in Salesforce's annual reports since it bought Slack on 21 July 2021; its annual reports describe Slack's users and paid customers only in words (Salesforce, 2022).
- 8 million people used Slack each week (weekly active users) in September 2017, with more than 35,000 paying companies, Slack's About page said (Slack, 2017).
- 9 million people used Slack each week (weekly active users) in December 2017, with more than 50,000 paying companies, Slack's About page said (Slack, 2017).
- 8 million people used Slack each day (daily active users) in mid-2018, with more than 70,000 paying companies, Slack's About page said, its first daily figure there (Slack, 2018).
- More than 35,000 paying companies used Slack in September 2017, its About page said, rising to 50,000 by December 2017 (Slack, 2017).
- More than 70,000 paying companies used Slack in June 2018, its About page said, alongside 500,000 organisations using it (Slack, 2018).
Webex and Google Meet
- 153 million attendees joined Webex meetings worldwide in January 2020, before the pandemic, Cisco said; attendees are counted per meeting, not as unique people (Cisco, 2020).
- 324 million attendees joined Webex meetings in March 2020, a record and more than double January's 153 million, Cisco said (Cisco, 2020).
- More than 500 million meeting participants used Webex in April 2020, generating 25 billion meeting minutes, more than triple February's volume, Cisco told investors (Cisco, 2020).
- Nearly 600 million participants used Webex in October 2020, almost double March's number, Cisco said on its November 2020 earnings call (Cisco, 2020).
- Nearly 600 million quarterly average users was the last Webex figure Cisco gave, on its February 2021 earnings call; it has published no Webex usage count since (Cisco, 2021).
- No Webex user or participant count has come from Cisco since February 2021: its earnings remarks to February 2026 mention Webex only as a source of collaboration revenue (Cisco, 2026).
- More than 100 million daily meeting participants were using Google Meet in April 2020, with roughly 3 million new users a day, Google chief executive Sundar Pichai said (Alphabet, 2020).
- More than 600 million Google Meet participants were counted in a single week at the peak between April and June 2020, Google said (Alphabet, 2020).
- 235 million daily meeting participants used Google Meet at its peak between July and September 2020, with more than 7.5 billion daily video call minutes, the last Meet usage count Google gave (Alphabet, 2020).
- More than 50 million people used AI-powered meeting notes in Google Meet in June 2025, Google said; it is a floor for Meet's users, not a total, and the only Meet usage figure since 2020 (Google, 2025).
Skype and Discord
- 170 million connected users had Skype in 2010, with over 207 billion minutes of voice and video calls that year, Microsoft said when it agreed to buy Skype in May 2011 (Microsoft, 2011).
- More than 300 million connected users a month used Skype in March 2016, Microsoft told its Build developer conference, as TechCrunch reported (TechCrunch, 2016).
- More than 300 million monthly active users and more than 40 million concurrent users had Skype in April 2019, by Microsoft's account in an Azure engineering blog (Microsoft, 2019).
- 40 million people used Skype each day in March 2020, up 70% in a month as the pandemic began, Microsoft said (Microsoft, 2020).
- More than 36 million people used Skype each day in February 2023, Microsoft said, the last Skype user figure before it retired the service on 5 May 2025 (Microsoft, 2023).
- Skype was retired on 5 May 2025 for both free and paid users, Microsoft's support page states; Skype for Business was not affected and Skype Number subscriptions ended in May 2026 (Microsoft, 2026).
- 100 million monthly active users on all devices was Discord's own figure on its company page in November 2020 (Discord, 2020).
- More than 150 million monthly active users had Discord in May 2022, CNBC reported in its Disruptor 50 profile (CNBC, 2022).
- More than 200 million global monthly active users on all devices was Discord's own count for 2025, shown on its company page from early 2026 until late March 2026 (Discord, 2026).
- More than 90 million daily active users on all devices is Discord's own figure for the fourth quarter of 2025, the count on its company page since April 2026 (Discord, 2026).
Gmail and Outlook

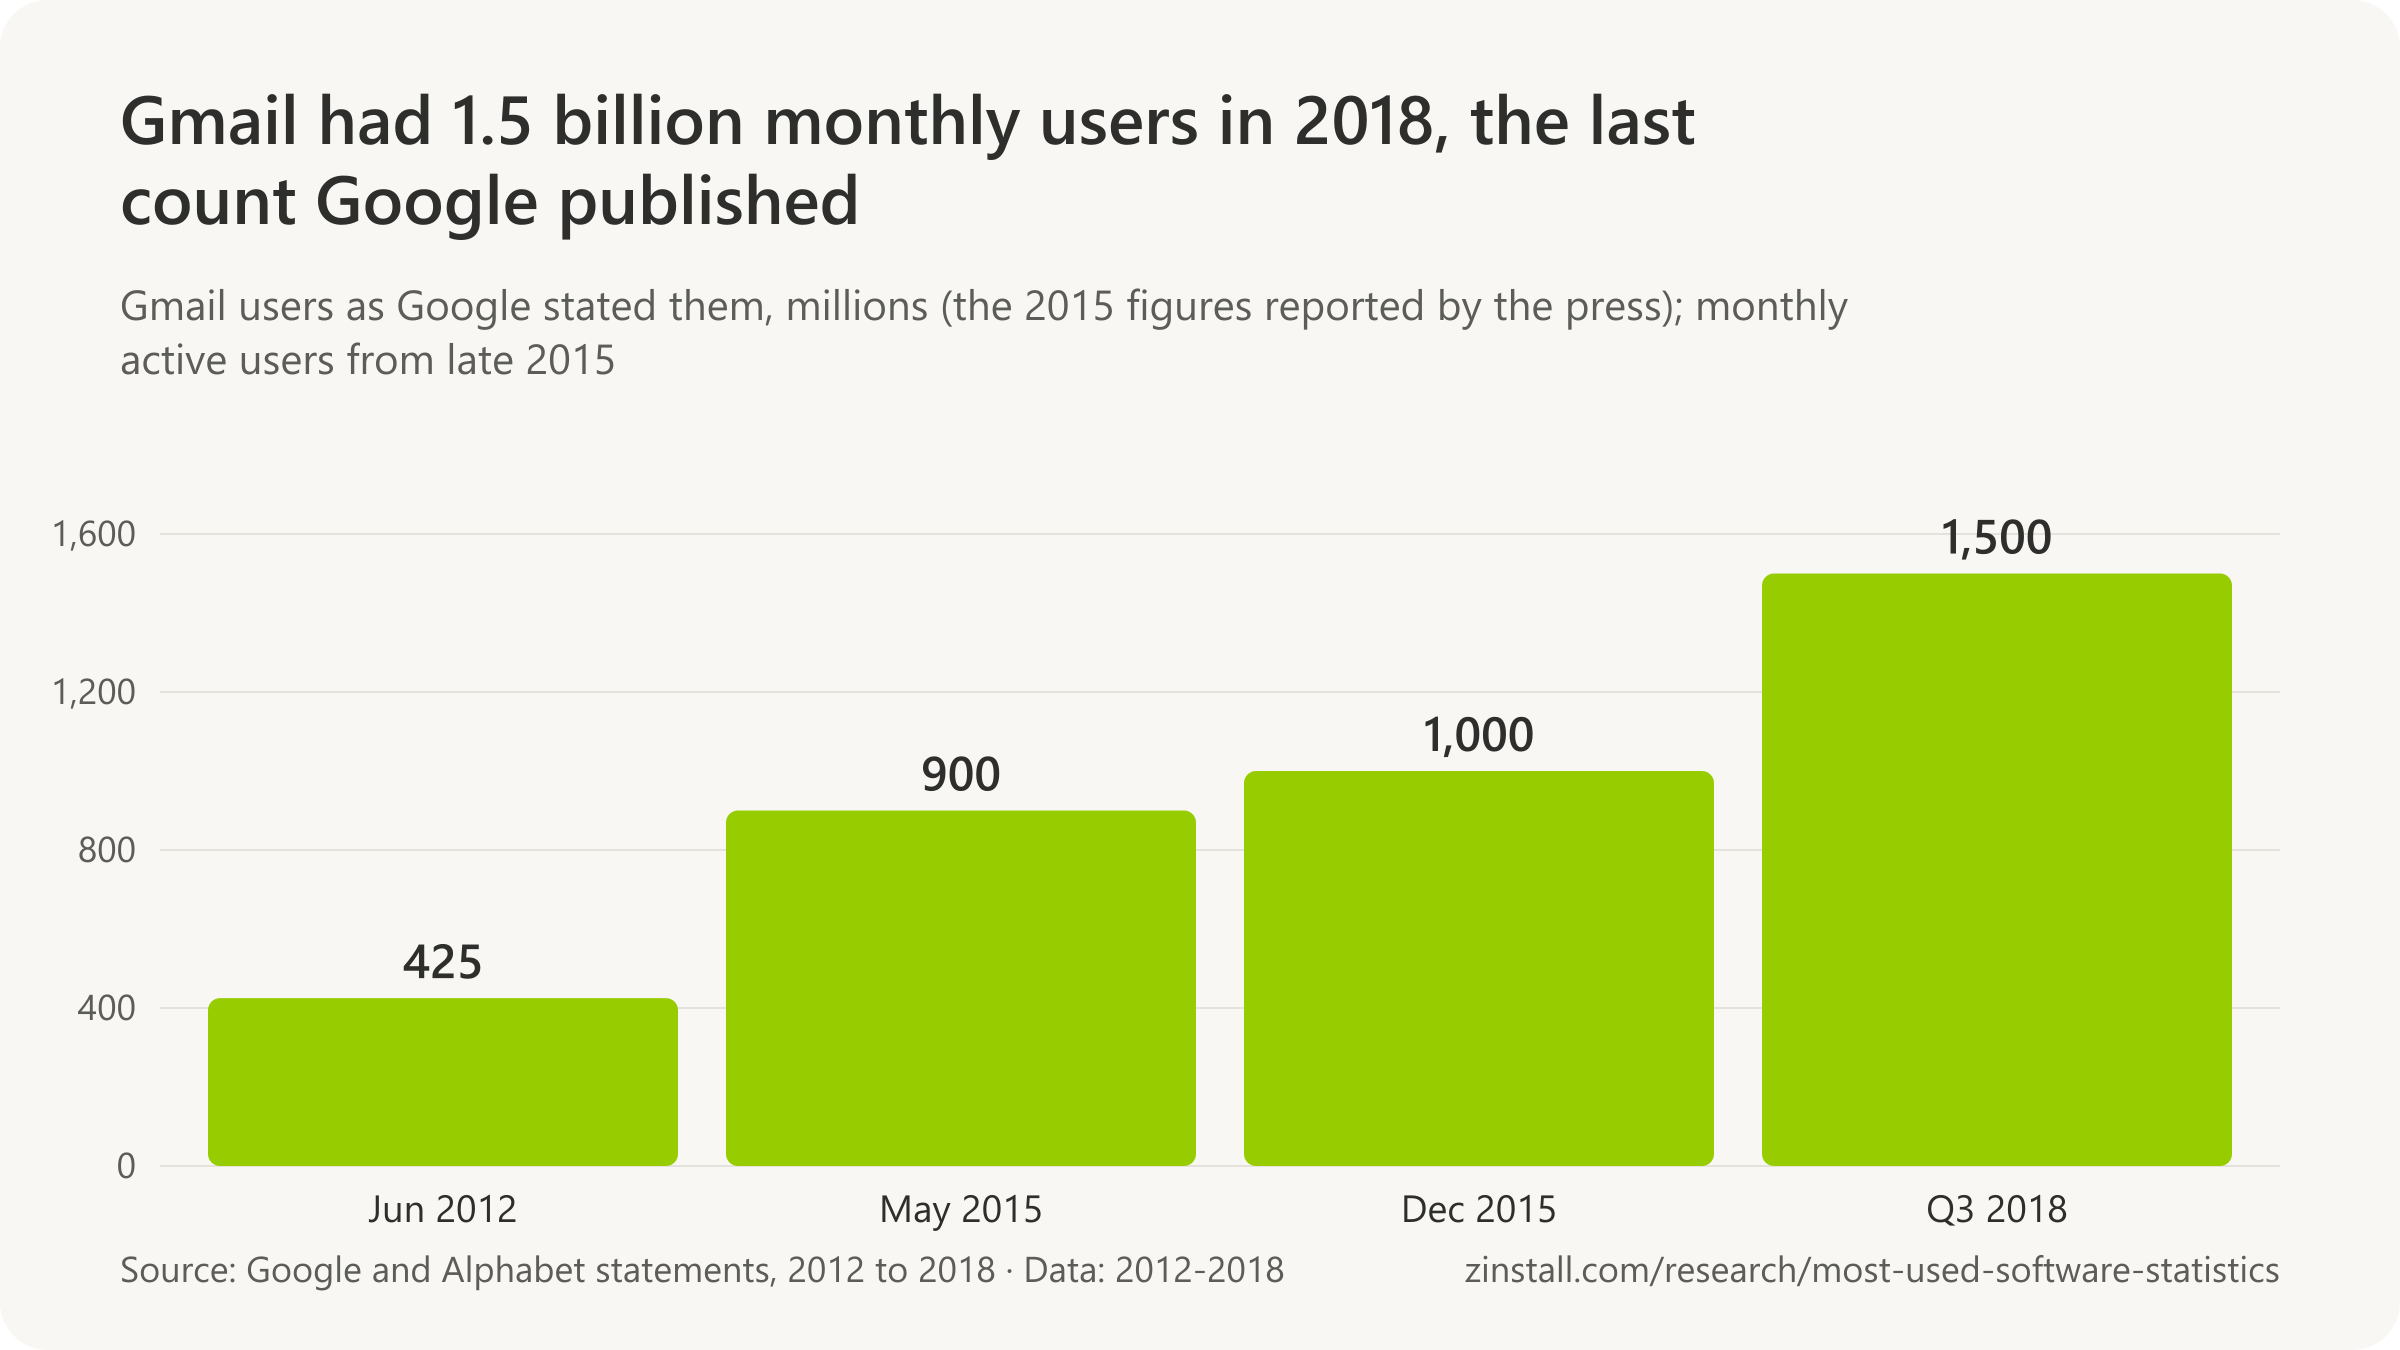
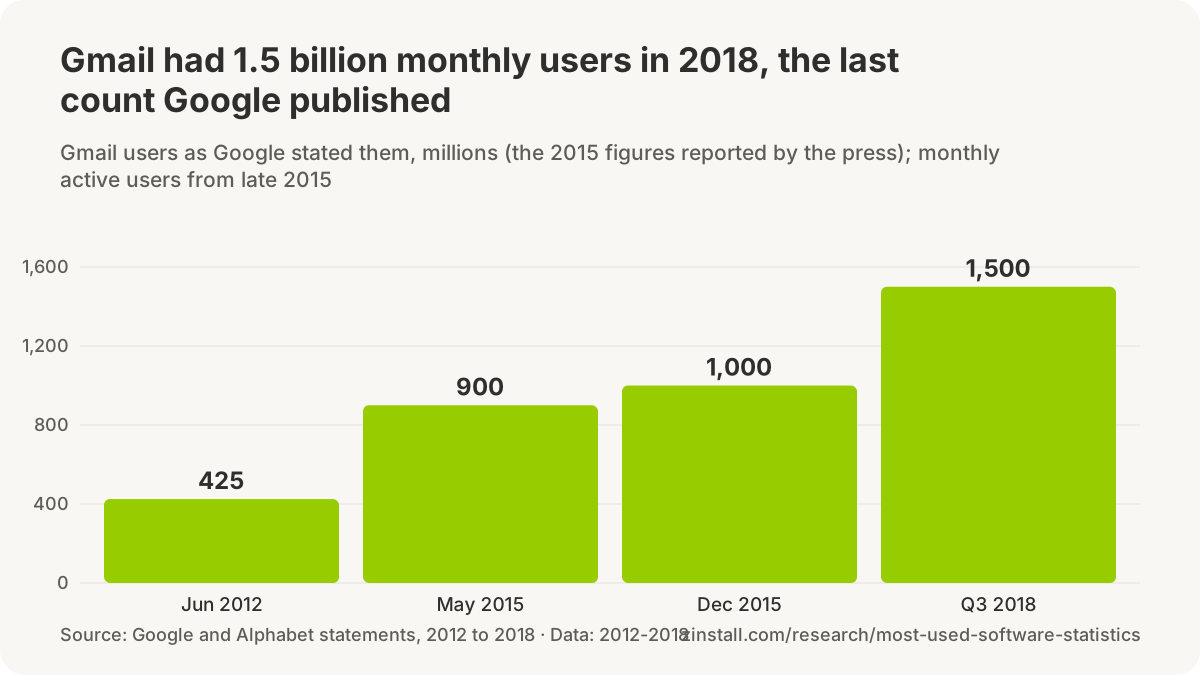
- More than 425 million active users had Gmail in June 2012, Google said on its official blog during its I/O conference (Google, 2012).
- 900 million users had Gmail in May 2015, three-quarters of them on mobile devices, Google's Sundar Pichai said at the I/O conference, as TechCrunch reported (TechCrunch, 2015).
- More than 1 billion people used Gmail each month (monthly active users) at the end of 2015, Google chief executive Sundar Pichai said on the February 2016 earnings call, as Android Central reported (Android Central, 2016).
- More than 1.5 billion people used Gmail each month (monthly active users) in October 2018, Google said on Alphabet's earnings call, the last Gmail user count Google has given (Alphabet, 2018).
- No Gmail user count has come from Google since October 2018: Alphabet's earnings calls from 2019 to July 2026 mention Gmail features but give no figure (Google, 2026).
- More than 400 million active Outlook.com accounts existed in May 2013 after Microsoft finished moving all Hotmail users to Outlook.com, 125 million of them used on mobile devices, the last Outlook.com count Microsoft published (Microsoft, 2013).
- More than 45 million monthly active devices ran the Outlook app on iOS and Android in October 2016, up more than 70% in a year, Microsoft said on its earnings call (Microsoft, 2016).
- More than 100 million people used the Outlook apps on iOS and Android in the quarter to March 2019, the first time they passed that mark, Microsoft said, its last Outlook user figure (Microsoft, 2019).
Email clients: what Litmus sees

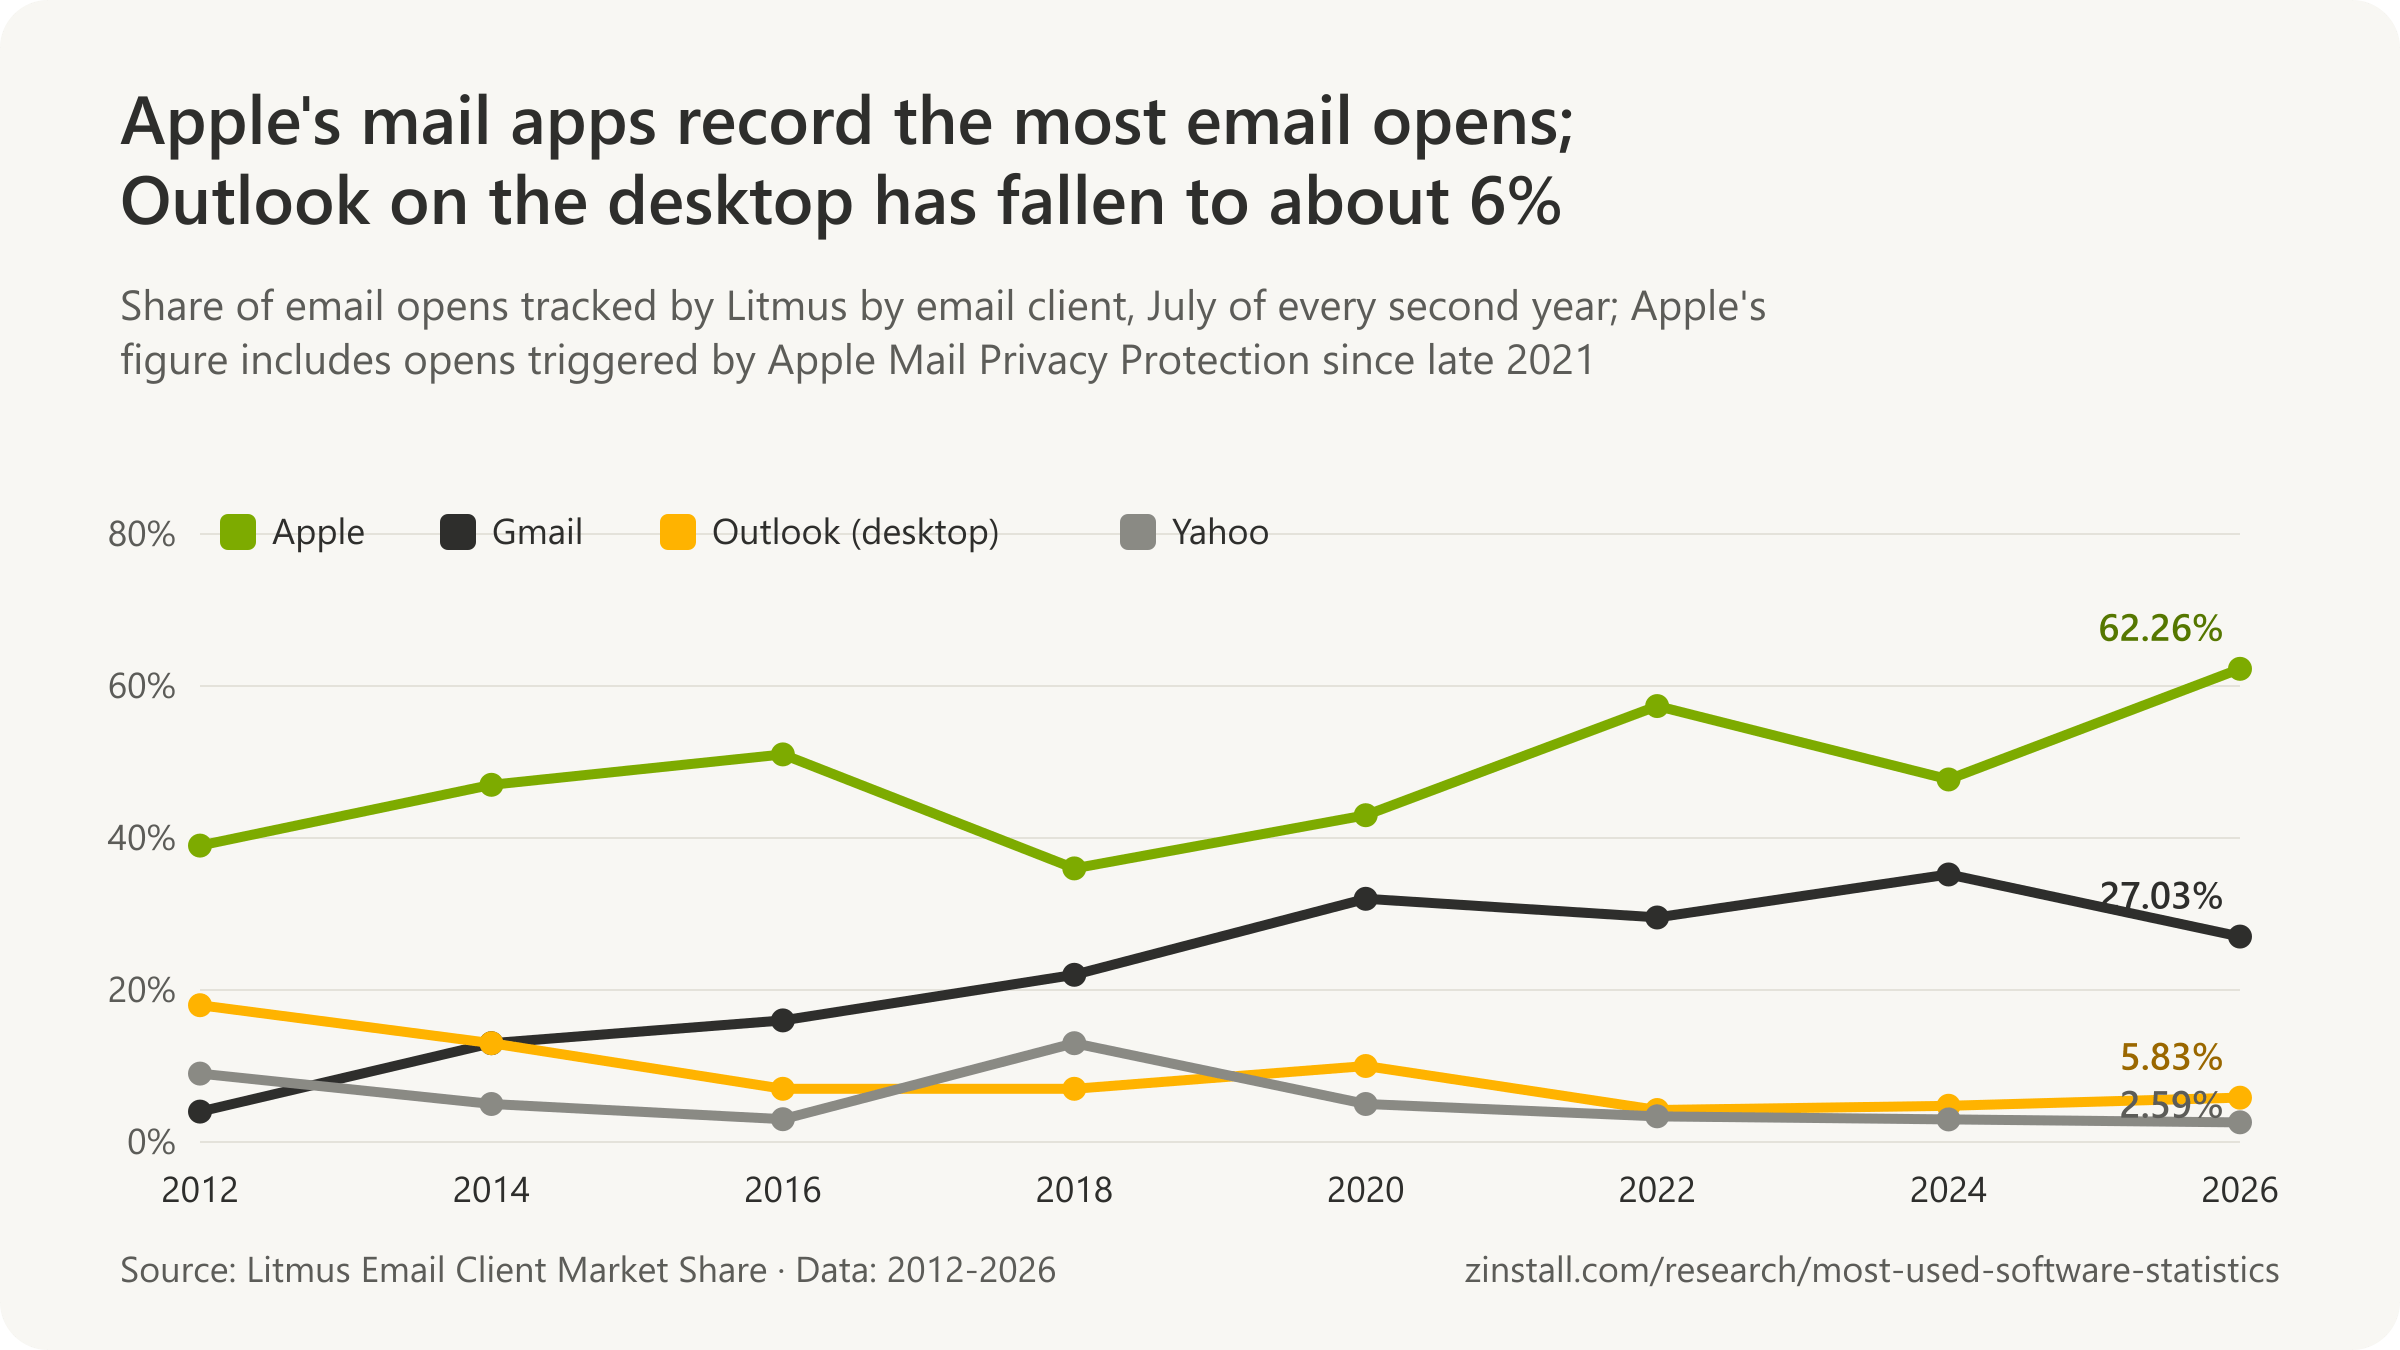
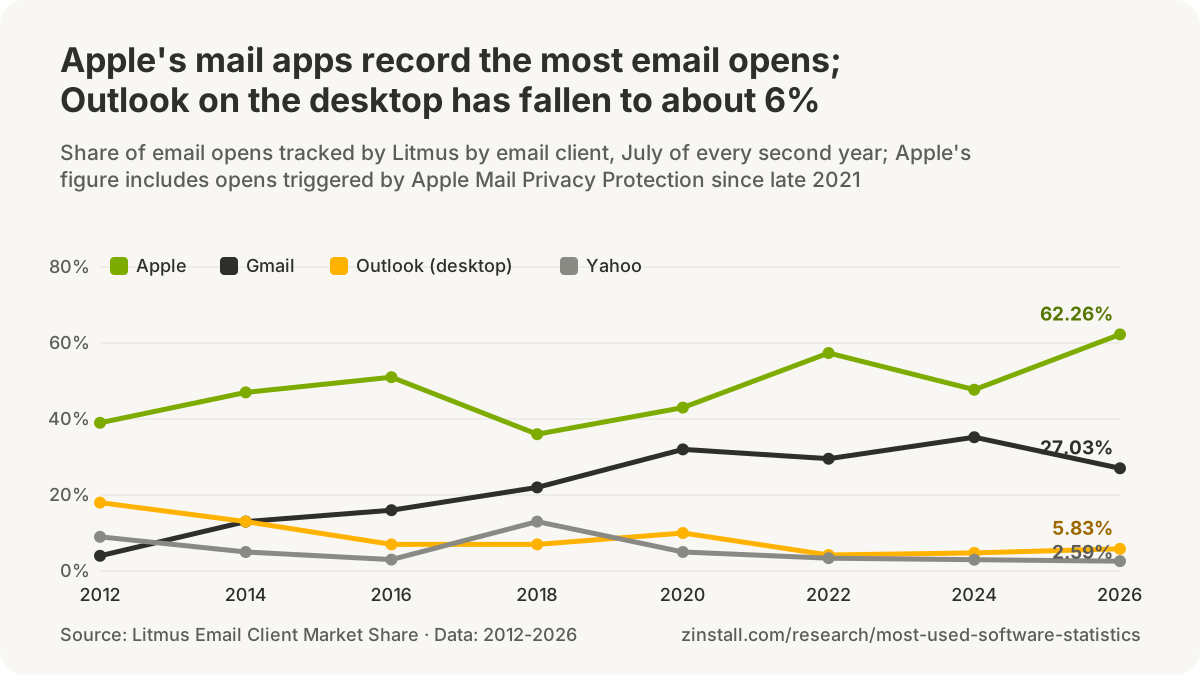
| Year and client | Share of opens |
|---|---|
| 2022: Apple | 57.4% |
| 2022: Gmail | 29.5% |
| 2022: Outlook (desktop) | 4.2% |
| 2022: Yahoo | 3.4% |
| 2023: Apple | 58.1% |
| 2023: Gmail | 28.7% |
| 2023: Outlook (desktop) | 4.1% |
| 2023: Yahoo | 2.5% |
| 2024: Apple | 47.7% |
| 2024: Gmail | 35.2% |
| 2024: Outlook (desktop) | 4.8% |
| 2024: Yahoo | 3.0% |
| 2025: Apple | 49.4% |
| 2025: Gmail | 25.9% |
| 2025: Outlook (desktop) | 3.6% |
| 2025: Yahoo | 2.2% |
| 2026: Apple | 62.3% |
| 2026: Gmail | 27.0% |
| 2026: Outlook (desktop) | 5.8% |
| 2026: Yahoo | 2.6% |
| 2026: Outlook.com | 0.4% |
| 2026: Thunderbird | 0.2% |
- Over 1 billion email opens tracked in July 2026 by Litmus Email Analytics, in emails sent by Litmus customers, are the sample behind Litmus's email client market share; it counts opens, not people (Litmus, 2026).
- 56.2% of all email opens tracked by Litmus in July 2023 were Apple Mail Privacy Protection opens, against 1.9% from Apple Mail, iPhone and iPad opens Litmus could identify, inside Apple's 58.1% share (Litmus, 2023).
- 19% of email opens tracked by Litmus in March 2016 happened in desktop email apps, against 31% a year earlier (Litmus, 2016).
- 16.1% of email opens tracked by Litmus in July 2021 happened in desktop email apps, the last month before Apple's Mail Privacy Protection blurred the split (Litmus, 2021).
- 6.5% of email opens tracked by Litmus in July 2022 happened in desktop email apps, with 52.2% classed as Apple Mail Privacy Protection opens that cannot be placed in any environment (Litmus, 2022).
- 55% of email opens tracked by Litmus in March 2016 happened in mobile email apps, against 48% a year earlier (Litmus, 2016).
- 42% of email opens tracked by Litmus in July 2021 happened in mobile email apps, the last month before Apple's Mail Privacy Protection blurred the split (Litmus, 2021).
- 4.4% of email opens tracked by Litmus in July 2022 happened in mobile email apps, with 52.2% classed as Apple Mail Privacy Protection opens that cannot be placed in any environment (Litmus, 2022).
- 26% of email opens tracked by Litmus in March 2016 happened in webmail, against 21% a year earlier (Litmus, 2016).
- 40.4% of email opens tracked by Litmus in July 2021 happened in webmail, the last month before Apple's Mail Privacy Protection blurred the split (Litmus, 2021).
- 36% of email opens tracked by Litmus in July 2022 happened in webmail, with 52.2% classed as Apple Mail Privacy Protection opens that cannot be placed in any environment (Litmus, 2022).
Thunderbird

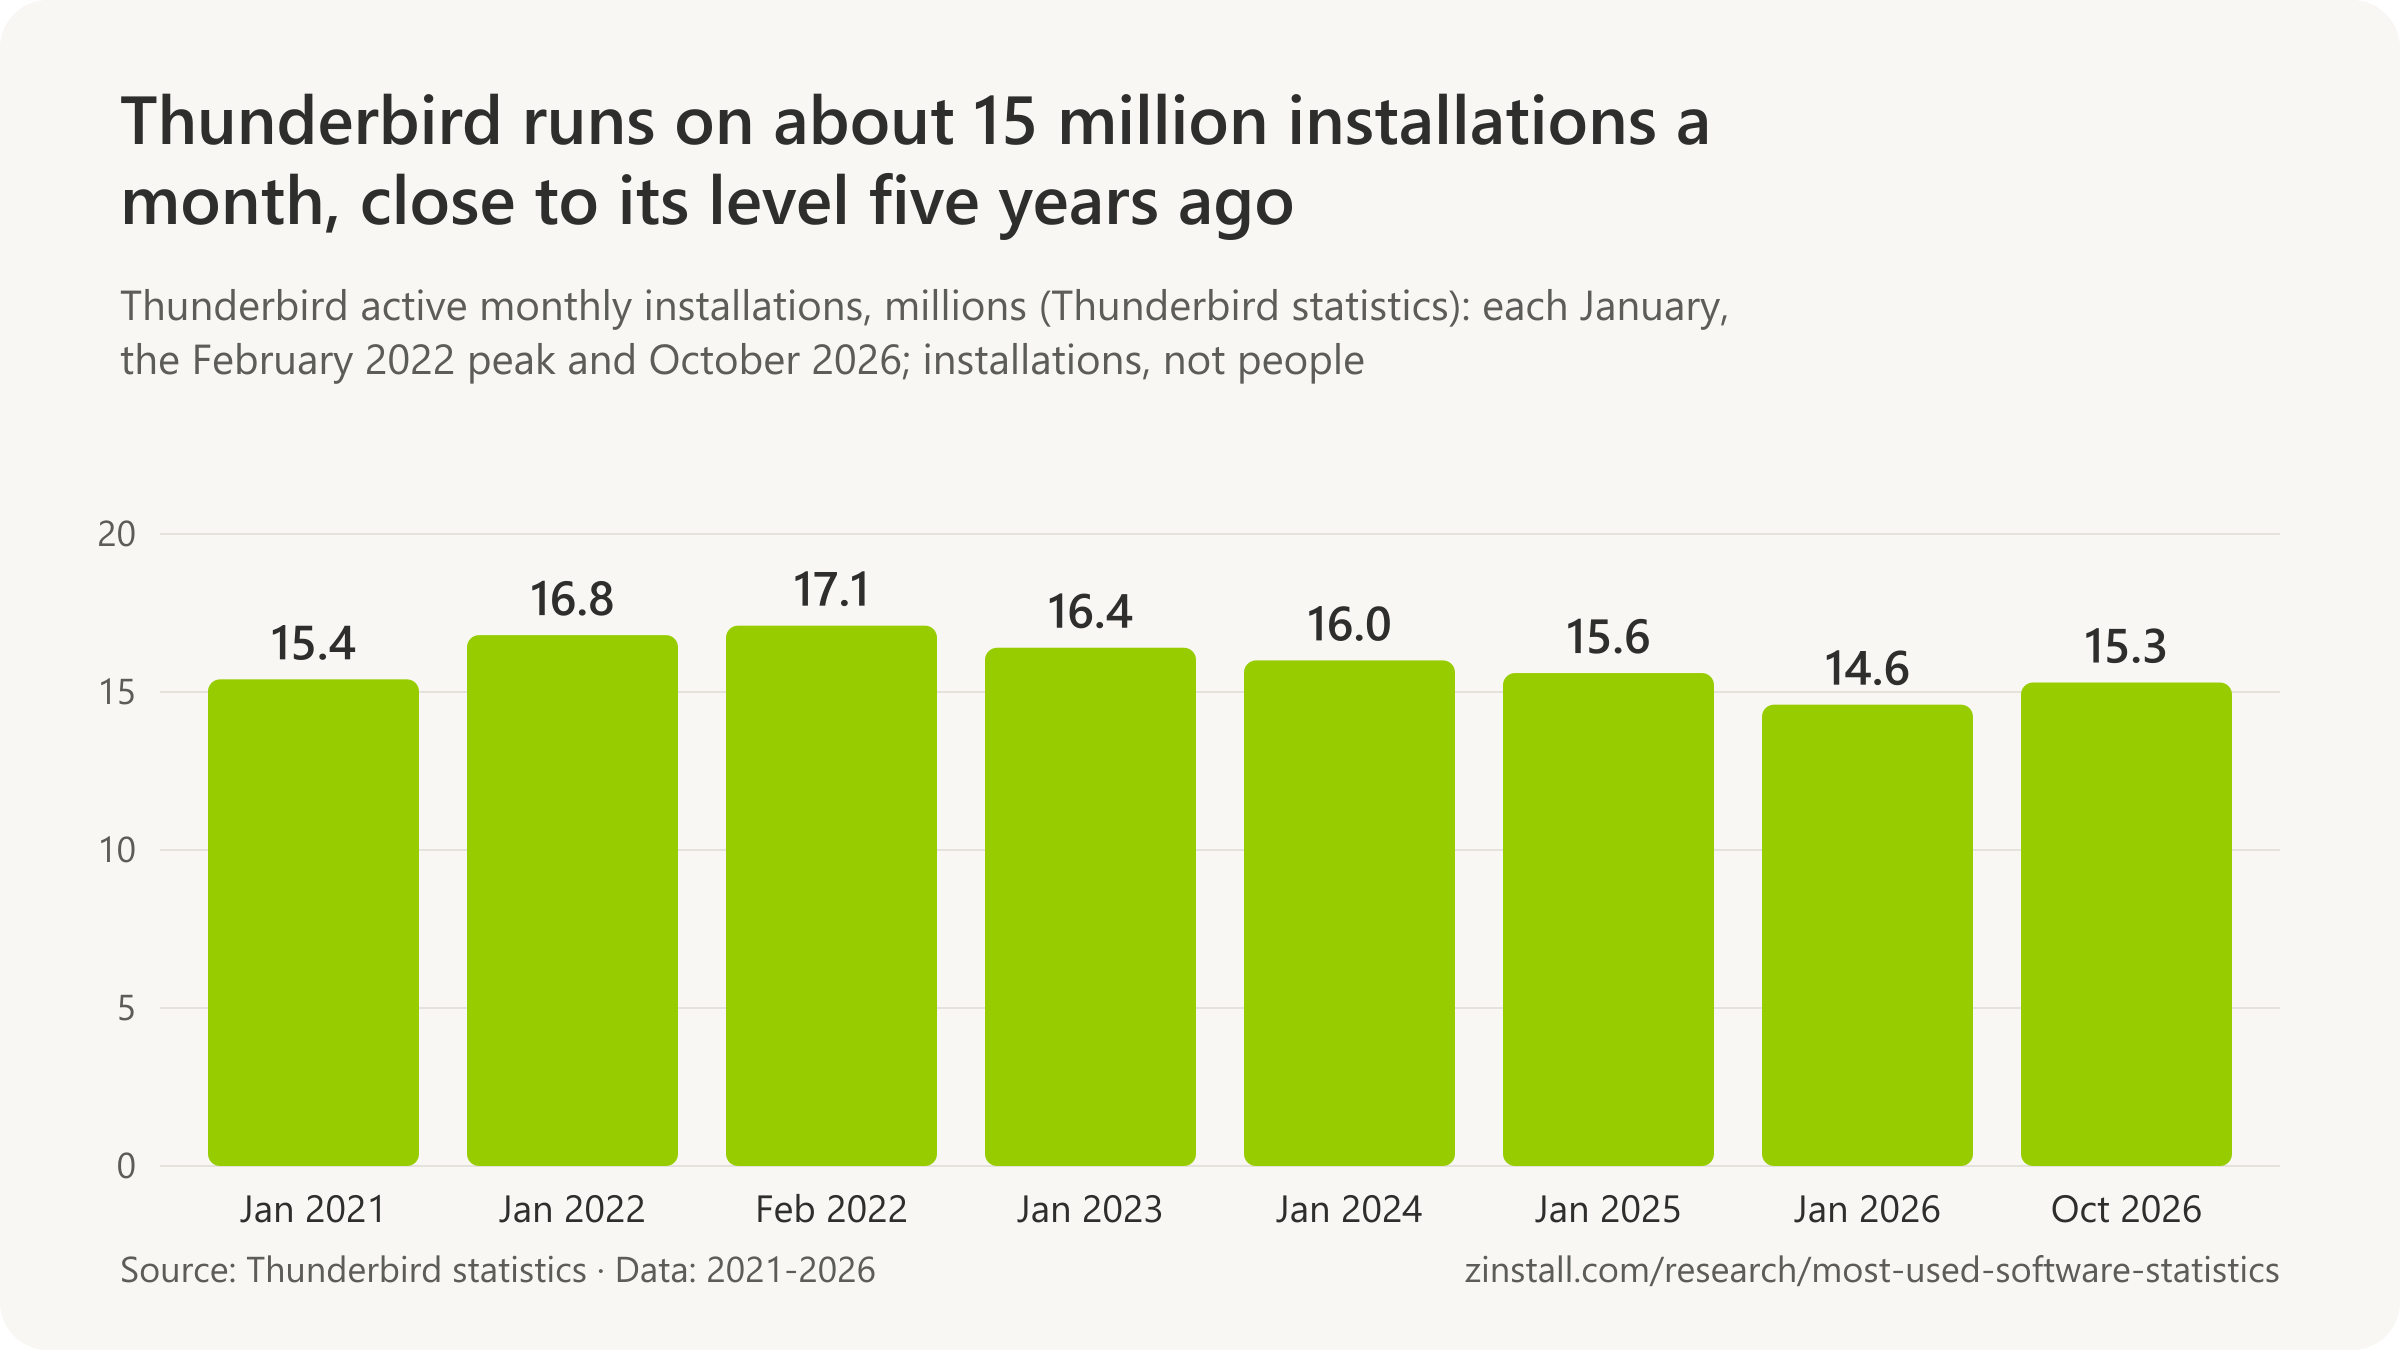
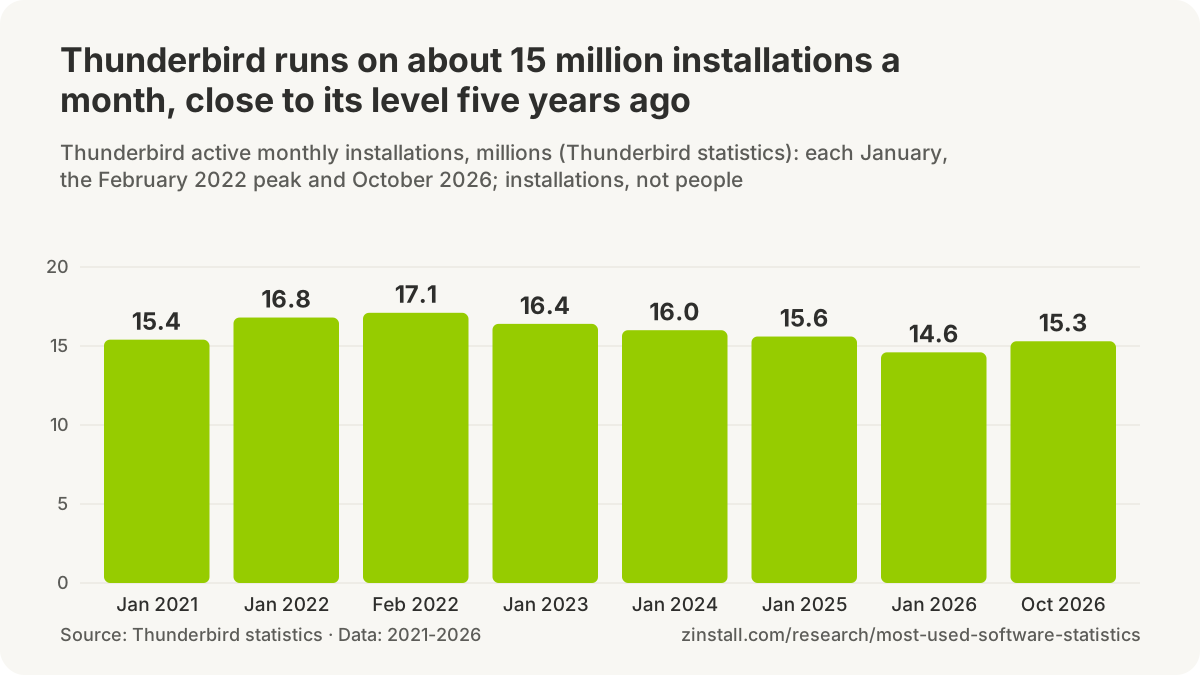
- 15.4 million active monthly installations of Thunderbird were counted in the 30 days to 3 January 2021, by the project's own estimate; installations are not people (Thunderbird, 2021).
- 16.8 million active monthly installations of Thunderbird were counted in the 30 days to 2 January 2022, by the project's own estimate; installations are not people (Thunderbird, 2022).
- 16.4 million active monthly installations of Thunderbird were counted in the 30 days to 1 January 2023, by the project's own estimate; installations are not people (Thunderbird, 2023).
- 16.0 million active monthly installations of Thunderbird were counted in the 30 days to 7 January 2024, by the project's own estimate; installations are not people (Thunderbird, 2024).
- 15.6 million active monthly installations of Thunderbird were counted in the 30 days to 5 January 2025, by the project's own estimate; installations are not people (Thunderbird, 2025).
- 14.6 million active monthly installations of Thunderbird were counted in the 30 days to 4 January 2026, by the project's own estimate; installations are not people (Thunderbird, 2026).
- 17.1 million active monthly installations of Thunderbird in the 30 days to 6 February 2022 is the highest reading of this 30-day count, which the project's dashboard updates weekly, since the dashboard began in December 2020 (Thunderbird, 2022).
- 15.3 million active monthly installations of Thunderbird were counted in the 30 days to 11 October 2026, by the project's own estimate, the latest value; installations are not people (Thunderbird, 2026).
- 10.2 million active daily installations of Thunderbird were counted on Tuesday 13 October 2026, by the project's own estimate; weekend days fall to about 5 million and installations are not people (Thunderbird, 2026).
- 9.0 million active daily installations of Thunderbird were running on average across 2025, by the project's own daily estimates, up from 7.3 million in 2023 (Thunderbird, 2026).
- $6,442,704 in donations reached the Thunderbird project in 2022, its 2022 financial report said, with user donations more than 99.9% of revenue (Thunderbird, 2023).
- $8.6 million in contributions reached Thunderbird in 2023 from more than 300,000 individual donors, up 34.5% on 2022, its 2023-2024 annual report said (Thunderbird, 2024).
- $10.3 million in donations reached Thunderbird in 2024, by the monthly figures on its own statistics dashboard (Thunderbird, 2026).
- $12.4 million in donations reached Thunderbird in 2025, up 20% on 2024 and about eight times the $1.5 million of 2019, by the monthly figures on its own statistics dashboard (Thunderbird, 2026).
Numbers in circulation
- Zoom's own 22 April 2020 blog post first described its 300 million daily meeting participants as 'more than 300 million daily users' and '300 million people', the wording behind the 'Zoom has 300 million daily users' figure still in circulation (Zoom, 2020).
- Windows Central reported on 23 April 2020 that 'Zoom now has more than 300 million daily users', repeating Zoom's uncorrected wording, and the article still carries that headline in October 2026 (Windows Central, 2020).
- DemandSage's Zoom statistics page, updated in July 2026, still states that 'Zoom has 300 million daily active users', a 2020 meeting-participant count relabelled as users and presented as current (DemandSage, 2026).
- Business of Apps gives Slack 'an estimated 42 million' daily active users, a figure no Slack or Salesforce disclosure supports: Slack's last published count was 12 million daily users in September 2019 (Business of Apps, 2026).
- Cisco's Webex blog gives April 2020 as 500 million meeting participants with 35 billion meeting minutes, against the 25 billion minutes Cisco gave investors for the same month (Cisco, 2020).
- The Associated Press reported for Gmail's 20th birthday in April 2024 that it 'now has 1.8 billion active accounts', a figure with no source given and no Google statement behind it; Google's last count was 1.5 billion monthly users in 2018 (AP, 2024).
- DemandSage's Teams statistics page (January 2026) states that 'Microsoft Teams has 320 million daily active users', turning Microsoft's October 2023 count of monthly users into daily users and presenting it as current (DemandSage, 2026).
- Countly's Teams user page (July 2026) gives '350 million monthly active users' as an 'official Microsoft figure, Q4 FY2026', but Microsoft's July 2026 earnings call gave no Teams count; Microsoft's last figure is 320 million (October 2023) (Countly, 2026).
Sources: Microsoft (2011-2026); Zoom Video Communications (2019-2026); The Verge; Zoom Communications; Slack Technologies (2017-2021); Slack; Salesforce; Cisco Systems (2020, 2021, 2026); Alphabet (2018, 2020); Google (2012, 2025, 2026); TechCrunch (2015, 2016); Discord (2020, 2026); CNBC; Android Central; Litmus (2012-2026); MZLA Technologies (2023, 2024, 2026); Windows Central; DemandSage (2026); Business of Apps; The Associated Press; Countly
What are the most used business apps?
Microsoft 365 was the No. 1 app among Okta's business customers in 2025, ahead of Google Workspace, AWS, Salesforce and Zoom (Okta, 2026).

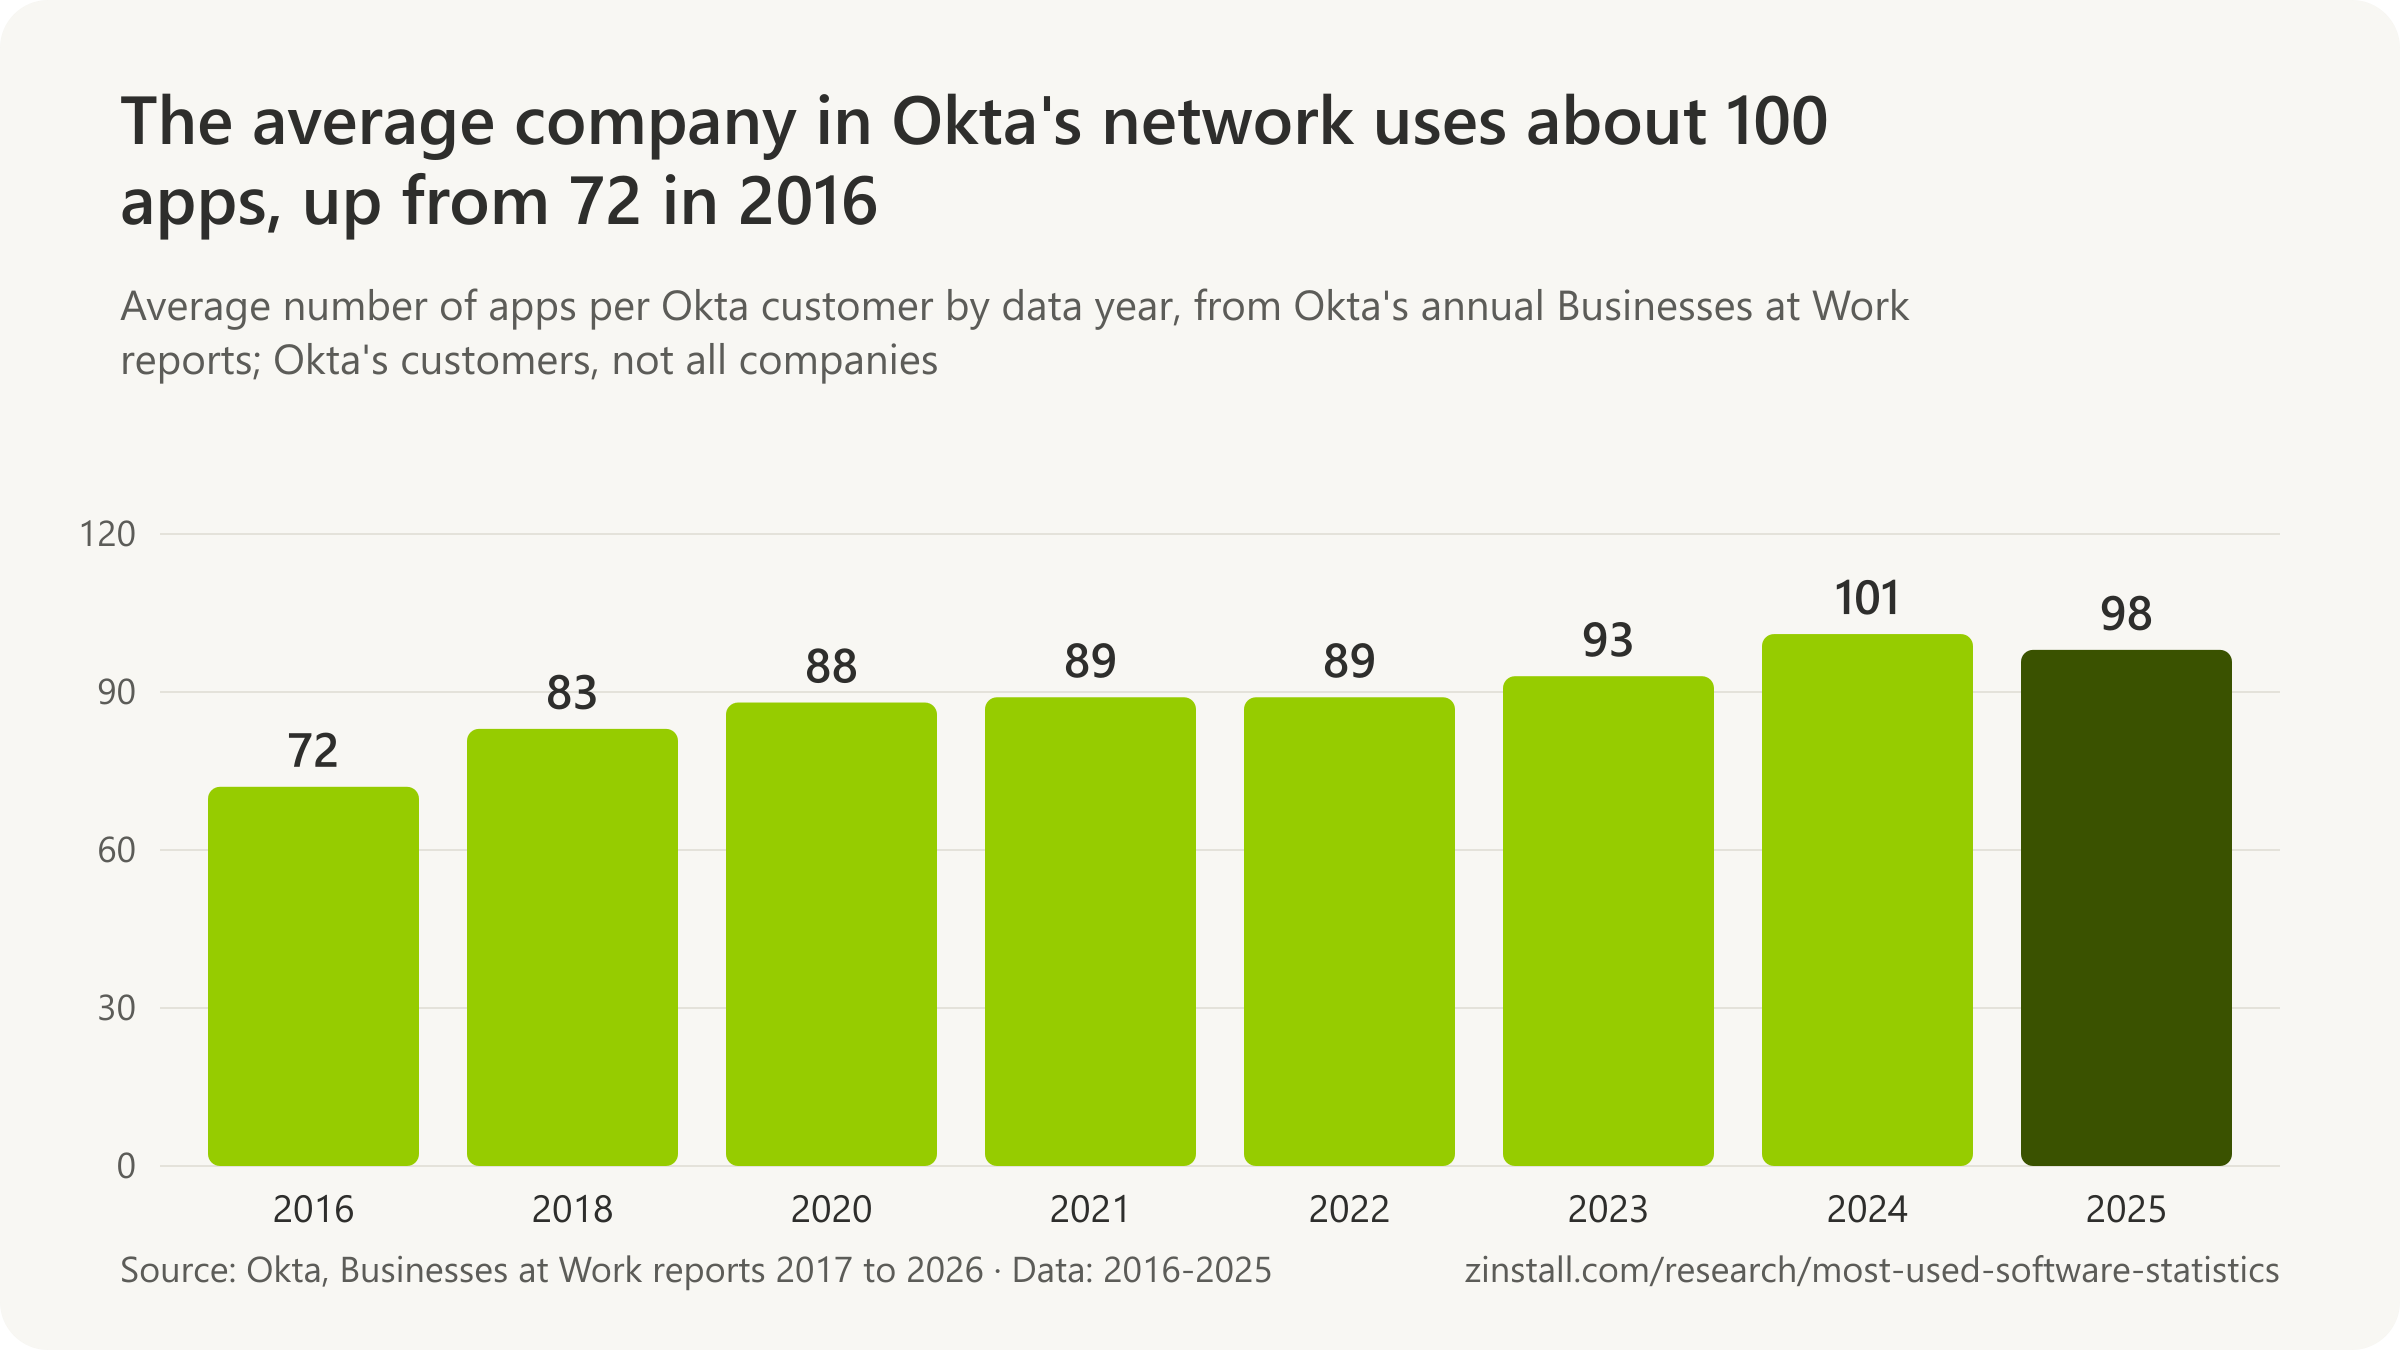
- Office 365 has led the business-app ranking of an identity provider's customers every year since it overtook Salesforce in January 2015.
- Okta's customers used 98 apps each on average in 2025.
- The fastest-growing app in Okta's network in 2025 was NinjaOne, up 240%.
- Okta's 2024 business-app report drew on 18,800 or more customer companies.
| Source, measure and year | Apps |
|---|---|
| Zylo: SaaS apps per organisation, 2025 | 305 |
| Zylo: small companies against large enterprises, 2024 | 152 vs 660 |
| Productiv: SaaS apps per company, 2023 | 342 |
| BetterCloud: SaaS apps per organisation, 2023 | 112 |
| BetterCloud: change in apps per organisation, 2026 | +11% |
| Okta: large customers against smaller ones, 2018 | 129 vs 73 |
Sources: Okta (2015-2026); Zylo (2026, 2025); Productiv; BetterCloud (2026, 2024)
Moving these programs to a new computer: MATLAB · Dragon NaturallySpeaking
More statistics (55)
The most consistent ranking of business apps is Okta's yearly Businesses at Work report, which counts how many of Okta's customers connect each app through its sign-on service. It describes companies that use Okta, not all businesses. SaaS-management vendors count the apps per company in other ways and get much higher averages.
The most used business apps in Okta's network
- Office 365 became the most deployed app by number of business customers in Okta's network in January 2015, overtaking Salesforce, which had led since Okta began tracking in 2012 (Okta, 2015).
- Office 365 remained the most popular app by number of customers in Okta's network in 2015, followed by Salesforce, Box and Google Apps (Okta, 2016).
- Office 365 remained the most popular app by number of customers in Okta's network in 2016, ahead of Salesforce and Box, while Amazon Web Services passed G Suite for fourth place (Okta, 2017).
- Office 365 was still the most popular app by number of customers in Okta's network in the year to October 2017, a lead it had held since January 2015 (Okta, 2018).
- Office 365 led Okta's ranking of the most popular business apps by number of customers in the year to October 2018, and increased its lead (Okta, 2019).
- Office 365 and Salesforce held first and second place by number of customers in Okta's network for the sixth year in a row in the year to October 2019 (Okta, 2020).
- Microsoft 365 kept first place by number of customers in Okta's network in the year to October 2020, while AWS took second place from Salesforce for the first time since 2015 (Okta, 2021).
- Microsoft 365 remained the most popular app by number of customers in Okta's network in the year to October 2021, ahead of AWS, Google Workspace, Salesforce and Zoom (Okta, 2022).
- Microsoft 365 kept first place by number of customers in Okta's network in the year to October 2022, while Google Workspace grew faster (32% against 21%) (Okta, 2023).
- Microsoft 365 was the most popular app by number of customers in Okta's network in the year to October 2023, and Google Workspace took second place for the first time (Okta, 2024).
- Microsoft 365 was the most popular app by number of customers in Okta's network in 2024, followed by Google Workspace, AWS, Salesforce and Zoom (Okta, 2025).
- Microsoft 365 was the most popular app by number of customers in Okta's network in the year to October 2025, followed by Google Workspace, AWS, Salesforce and Zoom (Okta, 2026).
Apps per company
- 15 off-the-shelf cloud apps was the median per company among Okta's customers in North America and Asia Pacific in 2015, and most businesses used between 11 and 16 (Okta, 2015).
- Between 10 and 16 off-the-shelf cloud apps was the median per company across company sizes in Okta's network in early 2016, up about 20% in a year (Okta, 2016).
- 24% growth in the median number of apps per customer was recorded in Okta's network over the two years from 2015 to 2017 (Okta, 2018).
- 129 apps per customer on average were deployed by Okta's large customers (2,000 or more employees) in 2018, against 73 at small and mid-sized customers (Okta, 2019).
- 88 apps per customer on average were deployed by Okta's customers in the year to October 2019, up from 83 a year earlier and 72 three years earlier (Okta, 2020).
- 88 apps per customer on average were deployed by Okta's customers in the year to October 2020, unchanged from a year earlier (175 at large companies, 73 at smaller ones) (Okta, 2021).
- 89 apps per customer on average were deployed by Okta's customers in the year to October 2021, up from 88 (187 at companies with 2,000 or more employees) (Okta, 2022).
- 89 apps per customer on average were used by Okta's customers in the year to October 2022, the same as a year earlier (211 at large organisations, 69 at smaller ones) (Okta, 2023).
- 93 apps per company on average were deployed by Okta's customers in the year to October 2023, up 4% from 89 after a multi-year pause (231 at large companies) (Okta, 2024).
- 101 apps per company on average were used by Okta's customers in 2024, above 100 for the first time after years of flat growth (Okta, 2025).
- 98 apps per company on average were deployed by Okta's customers in the year to October 2025, down 3% from 101, though large companies rose to 259 and smaller ones to 72 (Okta, 2026).
- 305 SaaS applications on average sat in organisations' portfolios in Zylo's 2026 SaaS Management Index, flat on a year earlier, while average SaaS spend rose 8% to $55.7 million (Zylo, 2026).
- 152 SaaS apps on average were used by companies of 1 to 500 employees and 660 by enterprises of 10,000 or more in Zylo's 2025 SaaS Management Index (Zylo, 2025).
- 254 SaaS apps on average were used by companies in Productiv's State of SaaS Sprawl 2021 report, 364 at enterprises, with only 45% of them in regular use (Productiv, 2021).
- 371 SaaS apps on average were used by organisations in mid-2023, up 32% since 2021, in Productiv's 2023 State of SaaS series (Productiv, 2023).
- 342 SaaS apps on average were in organisations' portfolios at the end of 2023, down 10% from 374 in 2022, in Productiv's 2024 State of SaaS report (Productiv, 2024).
- 16 SaaS apps on average were used per organisation in 2017, up from 12 in 2016 and 8 in 2015, in BetterCloud's survey of 1,827 IT professionals (BetterCloud, 2017).
- 80 SaaS applications on average were used per company in 2020, ten times the 8 of 2015, by BetterCloud's survey count (BetterCloud, 2020).
- 112 SaaS applications on average were used per company in 2023, down 14% from the 2022 peak of 130, the first fall BetterCloud had recorded (BetterCloud, 2024).
- 11% more SaaS apps per organisation on average were in use in BetterCloud's 2026 survey than a year earlier, the first rise after two years of consolidation, with 27 of them AI-powered (BetterCloud, 2026).
Fastest-growing apps in Okta's network
- 50% growth in usership made Slack the fastest-growing app in Okta's network between May and July 2015 (Okta, 2015).
- 77% customer growth made Slack the fastest-growing app in Okta's network in the second half of 2015 (Okta, 2016).
- 67% customer growth in six months made Zoom the fastest-growing app in Okta's network in the six months to 1 November 2016 (Okta, 2017).
- 389% year-over-year customer growth made Jamf the fastest-growing app in Okta's network in the year to October 2017 (Okta, 2018).
- 178% year-over-year customer growth made KnowBe4 the fastest-growing app in Okta's network in the year to October 2018 (Okta, 2019).
- 273% year-over-year customer growth made Snowflake the fastest-growing app in Okta's network in the year to October 2019 (Okta, 2020).
- 341% year-over-year customer growth made Amazon Business the fastest-growing app in Okta's network in the year to October 2020 (Okta, 2021).
- 240% year-over-year customer growth made Notion the fastest-growing app in Okta's network in the year to October 2021 (Okta, 2022).
- 172% year-over-year customer growth made Kandji the fastest-growing app in Okta's network in the year to October 2022 (Okta, 2023).
- 338% year-over-year customer growth made Vanta the fastest-growing app in Okta's network in the year to October 2023, the highest rate since Jamf's 389% in 2017 (Okta, 2024).
- Vanta was the fastest-growing app in Okta's network for the second year running in 2024, ahead of newcomer Bitwarden (Okta, 2025).
- 240% year-over-year growth made NinjaOne the fastest-growing app in Okta's network in the year to October 2025, ahead of CrowdStrike Falcon at 66% (Okta, 2026).
Okta's samples
- 2,500 business customers and 4,000 apps made up the dataset of Okta's first Businesses @ Work report in August 2015 (Okta, 2015).
- 29 apps on average were used by Okta's G Suite customers in 2016, against 22 for its Office 365 customers (Okta, 2017).
- 7,400 or more customers made up the dataset of Okta's 2020 Businesses @ Work report (Okta, 2020).
- 9,400 or more customers made up the dataset of Okta's 2021 Businesses at Work report (Okta, 2021).
- 14,000 or more customers made up the dataset of Okta's 2022 Businesses at Work report (Okta, 2022).
- 17,000 or more customers made up the dataset of Okta's 2023 Businesses at Work report (Okta, 2023).
- 18,800 or more customers made up the dataset of Okta's 2024 Businesses at Work report (Okta, 2024).
Salesforce, Dragon and MATLAB
- Over 150,000 companies were growing their business with Salesforce by its own website's claim, unchanged from June 2018 to December 2024 and gone from the page by July 2025 (Salesforce, 2024).
- Over 550,000 physicians used Dragon Medical, Nuance's speech recognition for clinicians, with over 55% of the US physician market, in Nuance's fiscal 2021 annual report, filed while Microsoft's agreed takeover was pending (Nuance, 2021).
- Over 5 million users of MATLAB and Simulink worldwide is MathWorks' own count, unchanged on its company pages since at least May 2022 (MathWorks, 2025).
Numbers in circulation
- Over 150,000 Salesforce customers 'as of 2026' is how a Notta statistics roundup restated the figure in March 2026, citing Statista, after Salesforce had already removed it from its own website (Notta, 2026).
Sources: Okta (2015-2026); Zylo (2025, 2026); Productiv (2021, 2023, 2024); BetterCloud (2017-2026); Salesforce; Nuance Communications; MathWorks; Notta
How many people use QuickBooks, Quicken and TurboTax?
TurboTax recorded 39.0 million US federal filing units in the 2026 tax season, 4.1 million of them with the installed desktop software (Intuit, 2026).

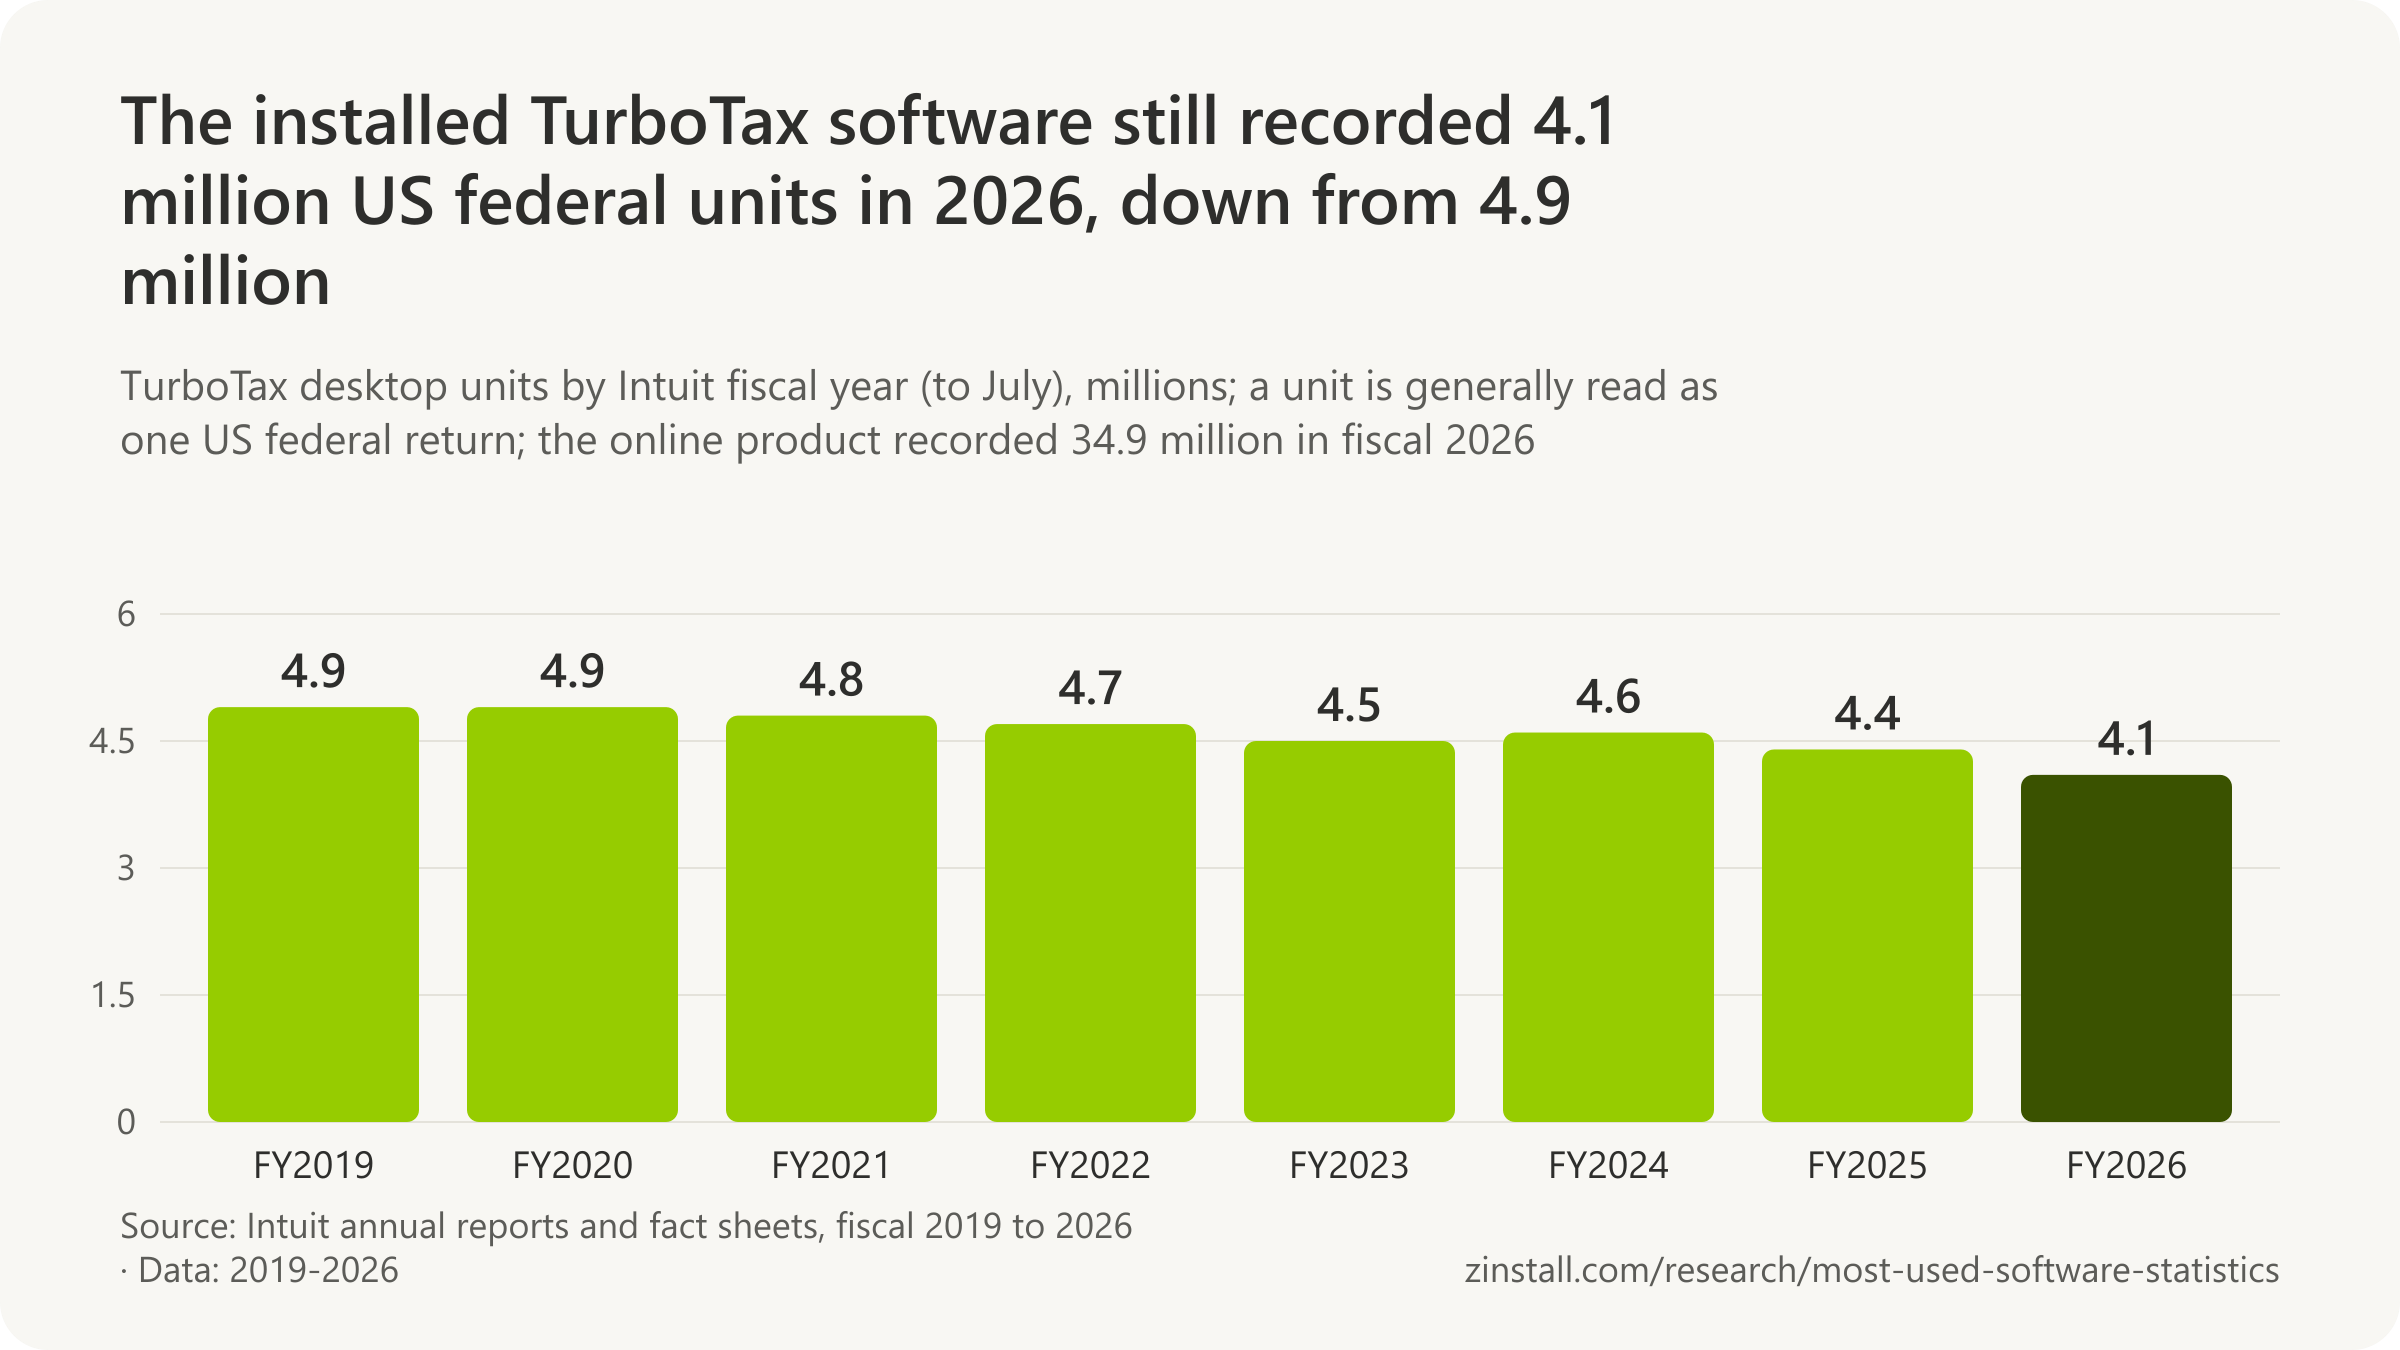
- Americans e-filed 67.1 million tax returns they prepared themselves in 2025.
- QuickBooks Online had more than 4.5 million subscribers in 2019, the last count Intuit published.
- Intuit counted 8.9 million paying customers of its online small-business products in July 2026.
- QuickBooks Desktop Plus stopped taking new US subscribers on 1 October 2024.
- Quicken says more than 20 million customers have used it over 40 years, not all of them current.
| Software, measure and date | Count |
|---|---|
| Intuit: customers across all its products, fiscal 2026 | about 93 million |
| QuickBooks Desktop: accounting revenue, fiscal 2026 | $1.8 billion |
| TurboTax units against self-prepared e-filed returns, 2025 | about 60% |
| H&R Block: paid do-it-yourself online returns, fiscal 2026 | 3.6 million |
| H&R Block: desktop software returns, fiscal 2022 (last count) | 1.9 million |
| Xero: customers, March 2026 | 4.92 million |
| Sage: customers, 2013 (last count) | more than 6 million |
| FreshBooks: people who have ever used it, 2026 | over 30 million (cumulative) |
Sources: Intuit (2019-2026); Internal Revenue Service; Quicken Inc.; H&R Block (2026, 2022); Xero Limited; The Sage Group plc; FreshBooks
Moving these programs to a new computer: QuickBooks · Quicken · TurboTax · Sage · Peachtree
More statistics (33)
Intuit counts TurboTax units (federal returns filed with TurboTax), counted QuickBooks Online subscribers until 2019 and now counts 'online ecosystem' paying customers. The IRS counts returns people prepare themselves. Quicken's and Sage's totals are rounded marketing figures.
TurboTax and do-it-yourself tax returns

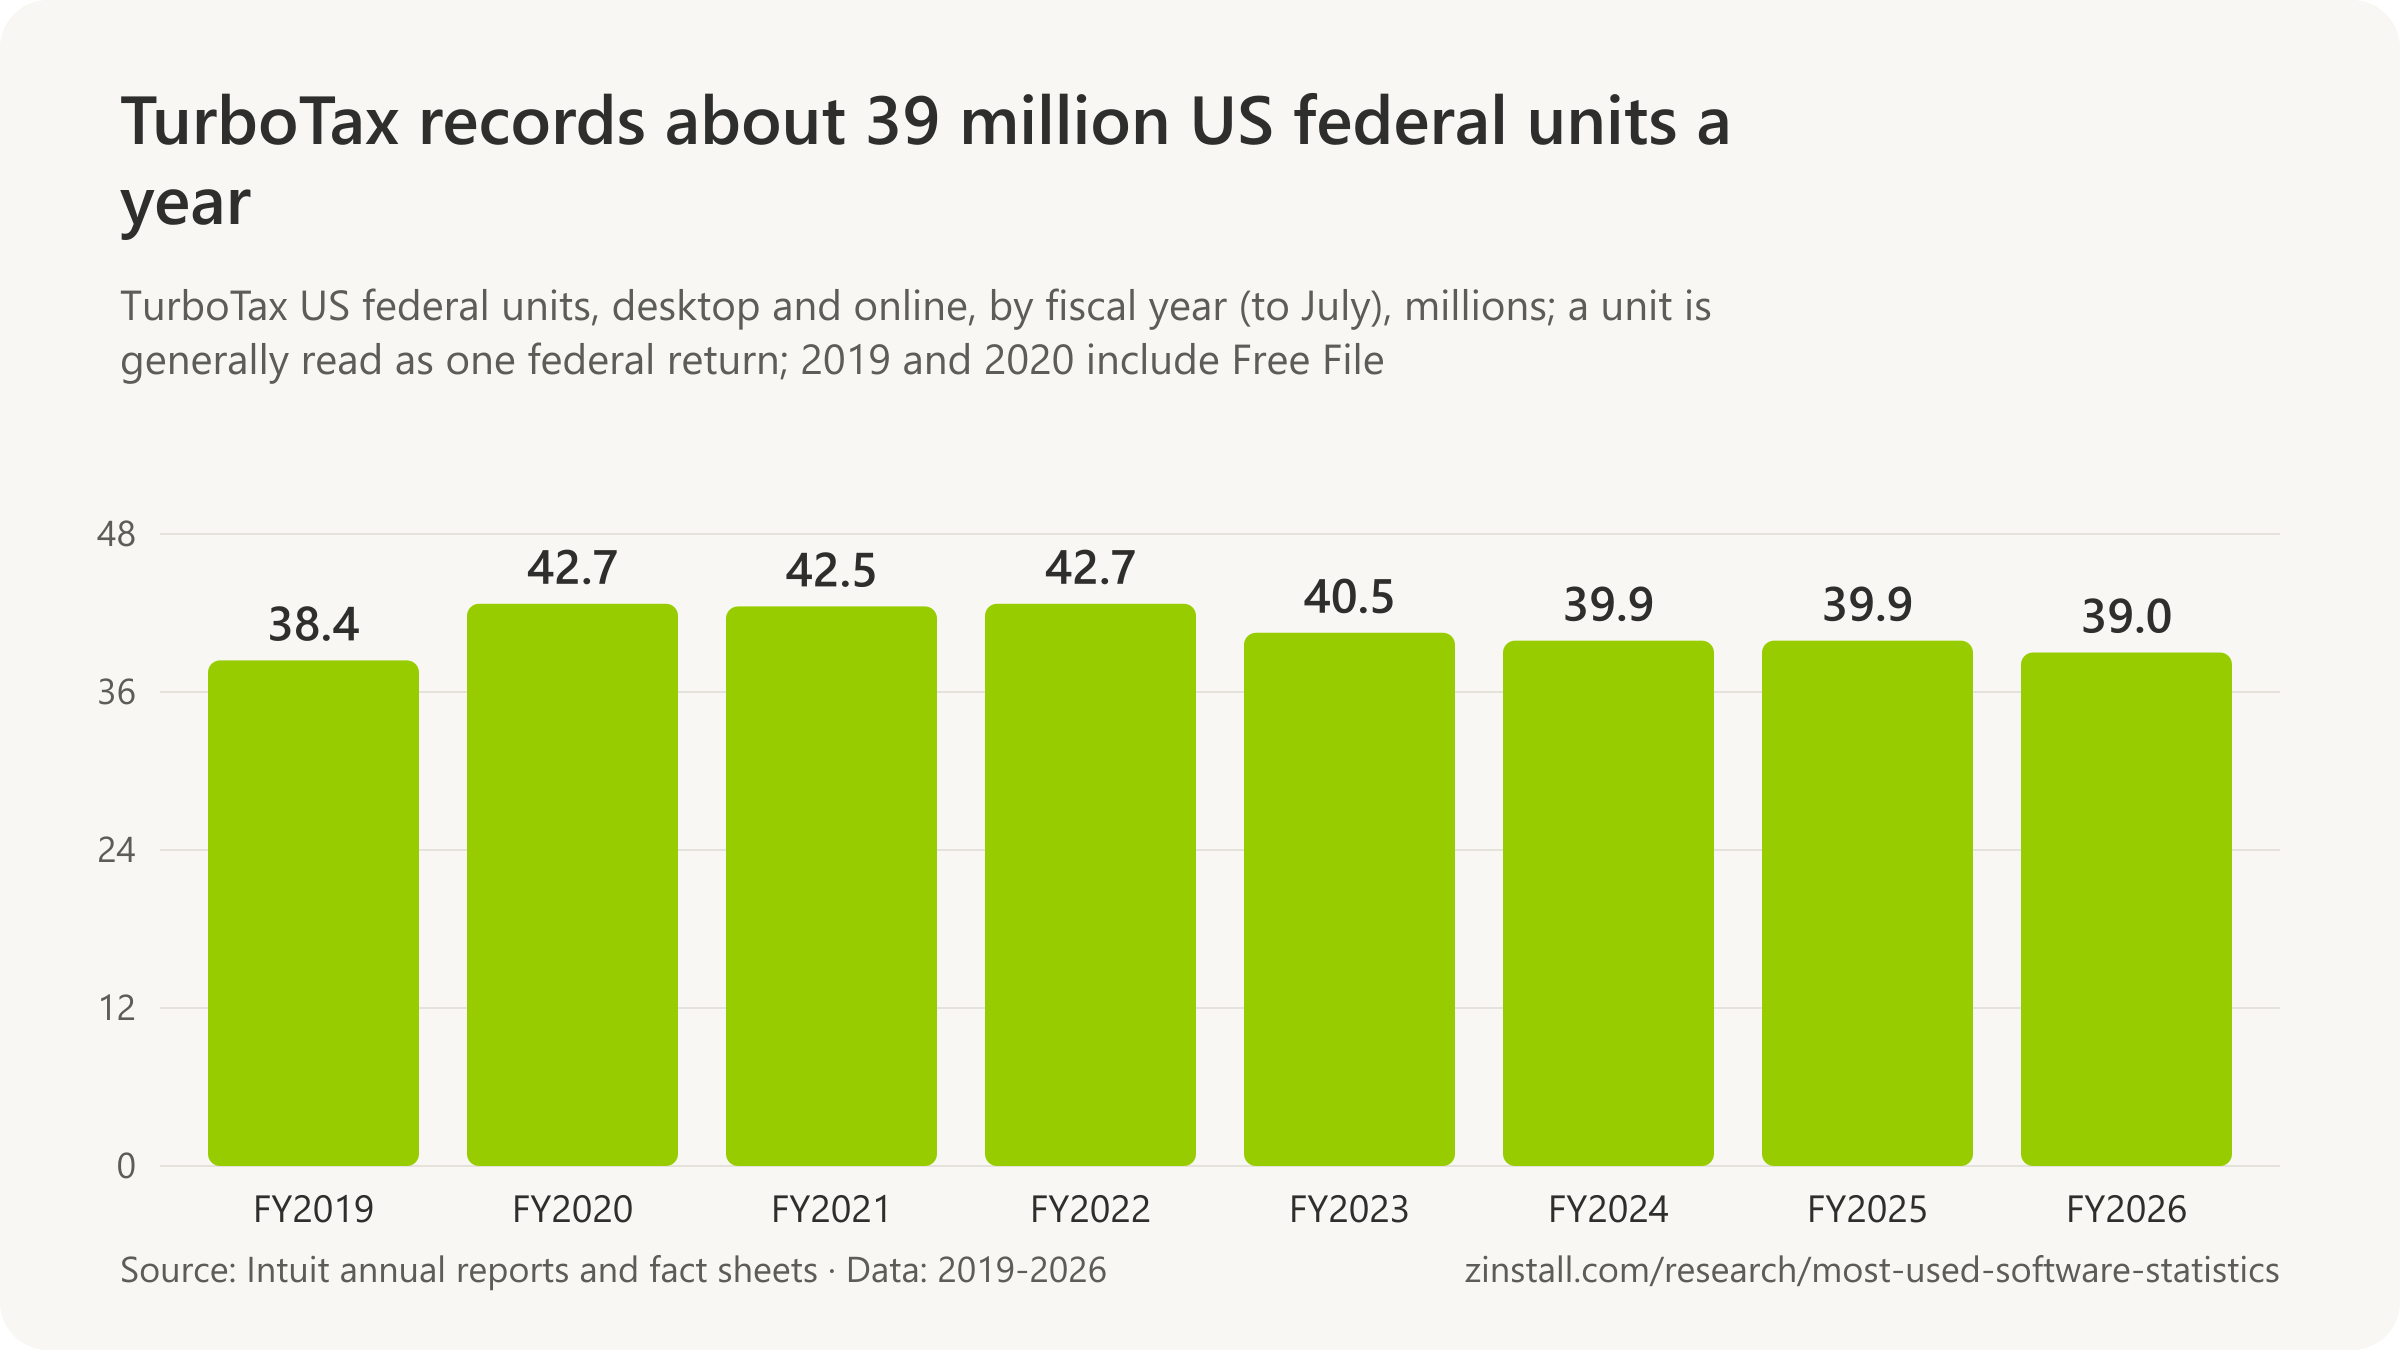
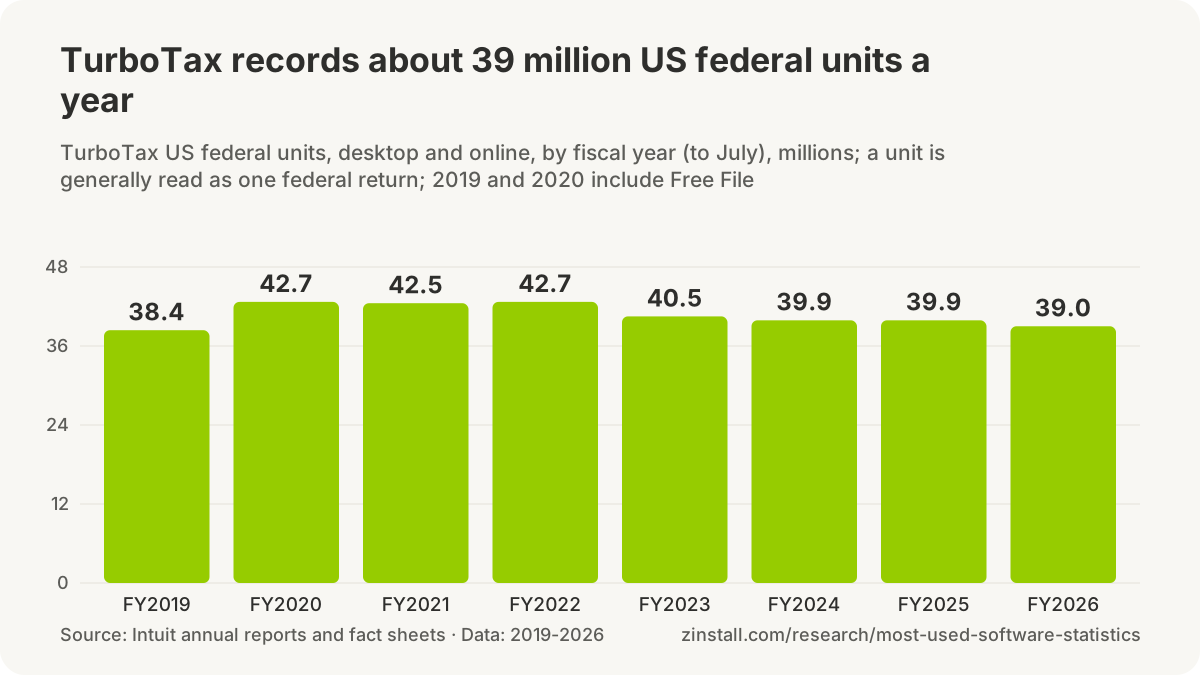

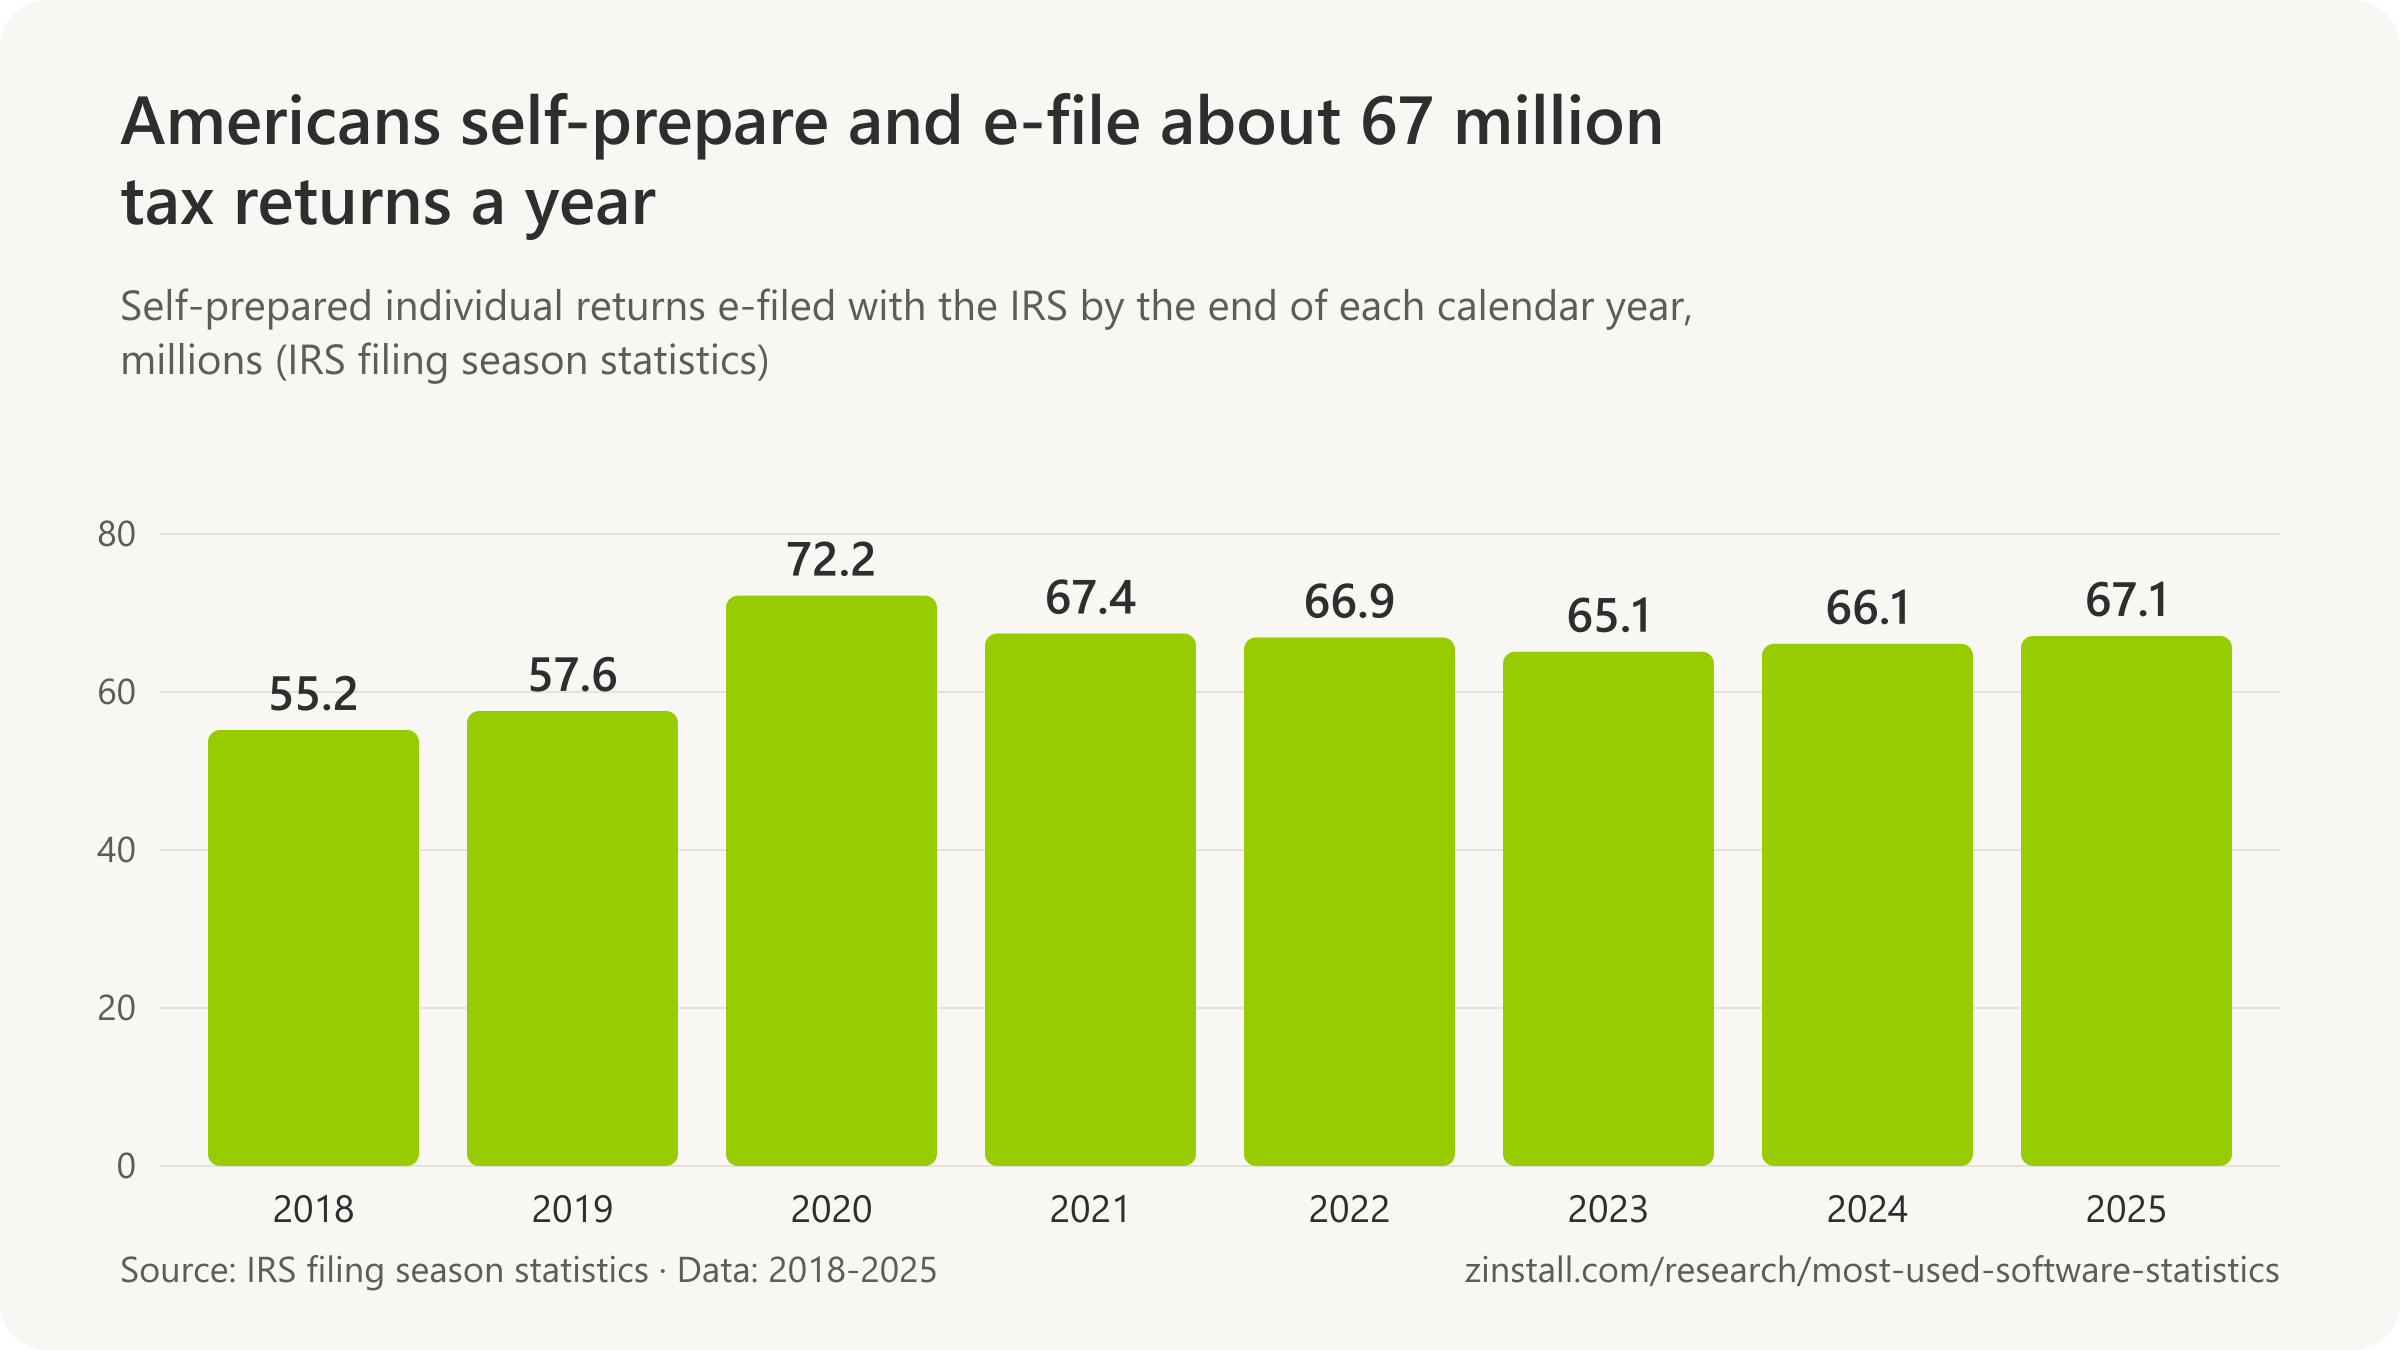
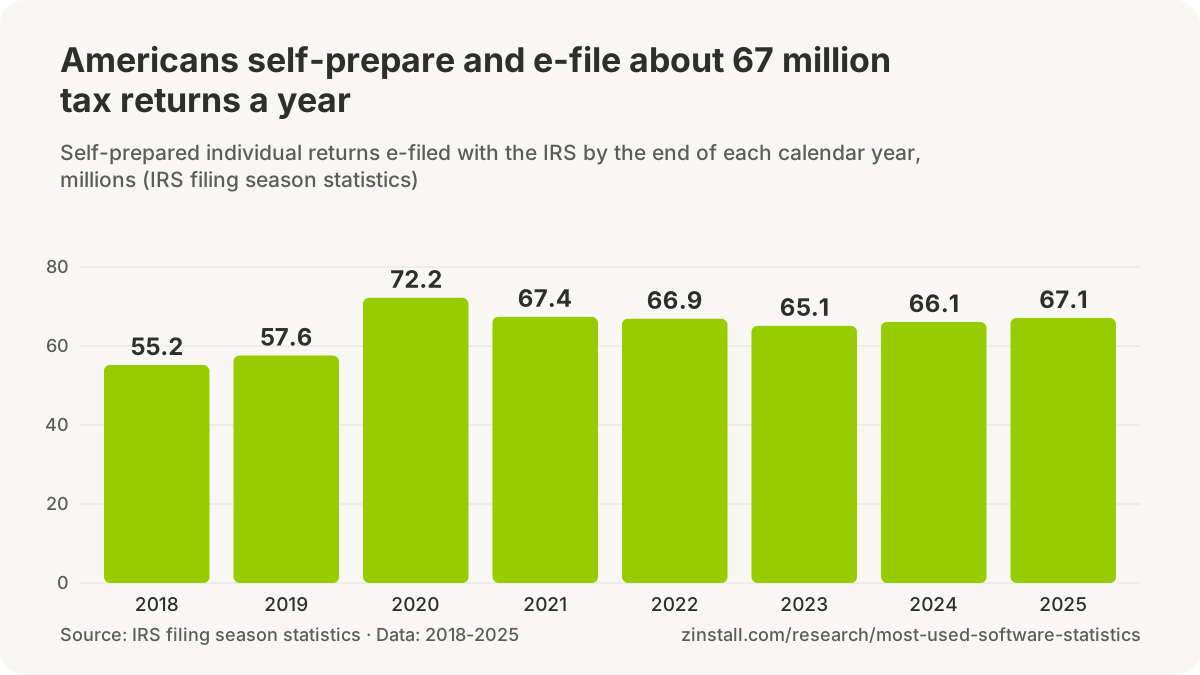
- 39.0 million US federal TurboTax units were recorded in the 2026 filing season (Intuit's fiscal year to July 2026), down 2% from 39.9 million (Intuit, 2026).
- 4.1 million US federal units were done with the TurboTax desktop software in the 2026 filing season, down 7% from 4.4 million, against 34.9 million online (Intuit, 2026).
- 39.9 million US federal TurboTax units were recorded in the 2024 filing season, down 1% from 40.5 million, with 4.6 million on the desktop software (Intuit, 2024).
- 42.7 million US federal TurboTax units were recorded in the 2022 filing season, level with 42.5 million in 2021, with 4.7 million on the desktop software (Intuit, 2022).
- 42.7 million US federal TurboTax units were recorded in the 2020 filing season including 2.0 million Free File Alliance units, up 11% from 38.4 million, with 4.9 million on the desktop software (Intuit, 2020).
- 67.1 million US individual tax returns were e-filed by taxpayers themselves (self-prepared) in 2025 through 26 December, against 87.9 million e-filed by tax professionals (IRS, 2025).
- 65.7 million US individual tax returns were e-filed by taxpayers themselves (self-prepared) in 2026 through 8 May, up 1.7% on the same point of 2025 (IRS, 2026).
- 65.1 million US individual tax returns were e-filed by taxpayers themselves (self-prepared) in 2023 through 29 December, down 2.8% from 66.9 million in 2022 (IRS, 2023).
- 67.4 million US individual tax returns were e-filed by taxpayers themselves (self-prepared) in 2021 through 3 December, down 6.7% from the 2020 peak of 72.2 million (IRS, 2021).
- 57.6 million US individual tax returns were e-filed by taxpayers themselves (self-prepared) in 2019 through 27 December, up 4.4% from 55.2 million in 2018 (IRS, 2019).
- 59.5%, or about 6 in 10, is the ratio of TurboTax's 39.9 million US federal units in the 2025 season to the 67.1 million self-prepared returns e-filed with the IRS in 2025 (calculation from Intuit and IRS figures, 2026).
- 3.6 million paid do-it-yourself returns were filed by clients with H&R Block's online tax software in its fiscal year to June 2026, beside 11.3 million US returns prepared by its tax professionals (H&R Block, 2026).
- 1.9 million US returns were filed with H&R Block's desktop tax software in the year to June 2022, down 18.7% from 2.3 million, the last year its annual report broke out desktop returns (H&R Block, 2022).
QuickBooks

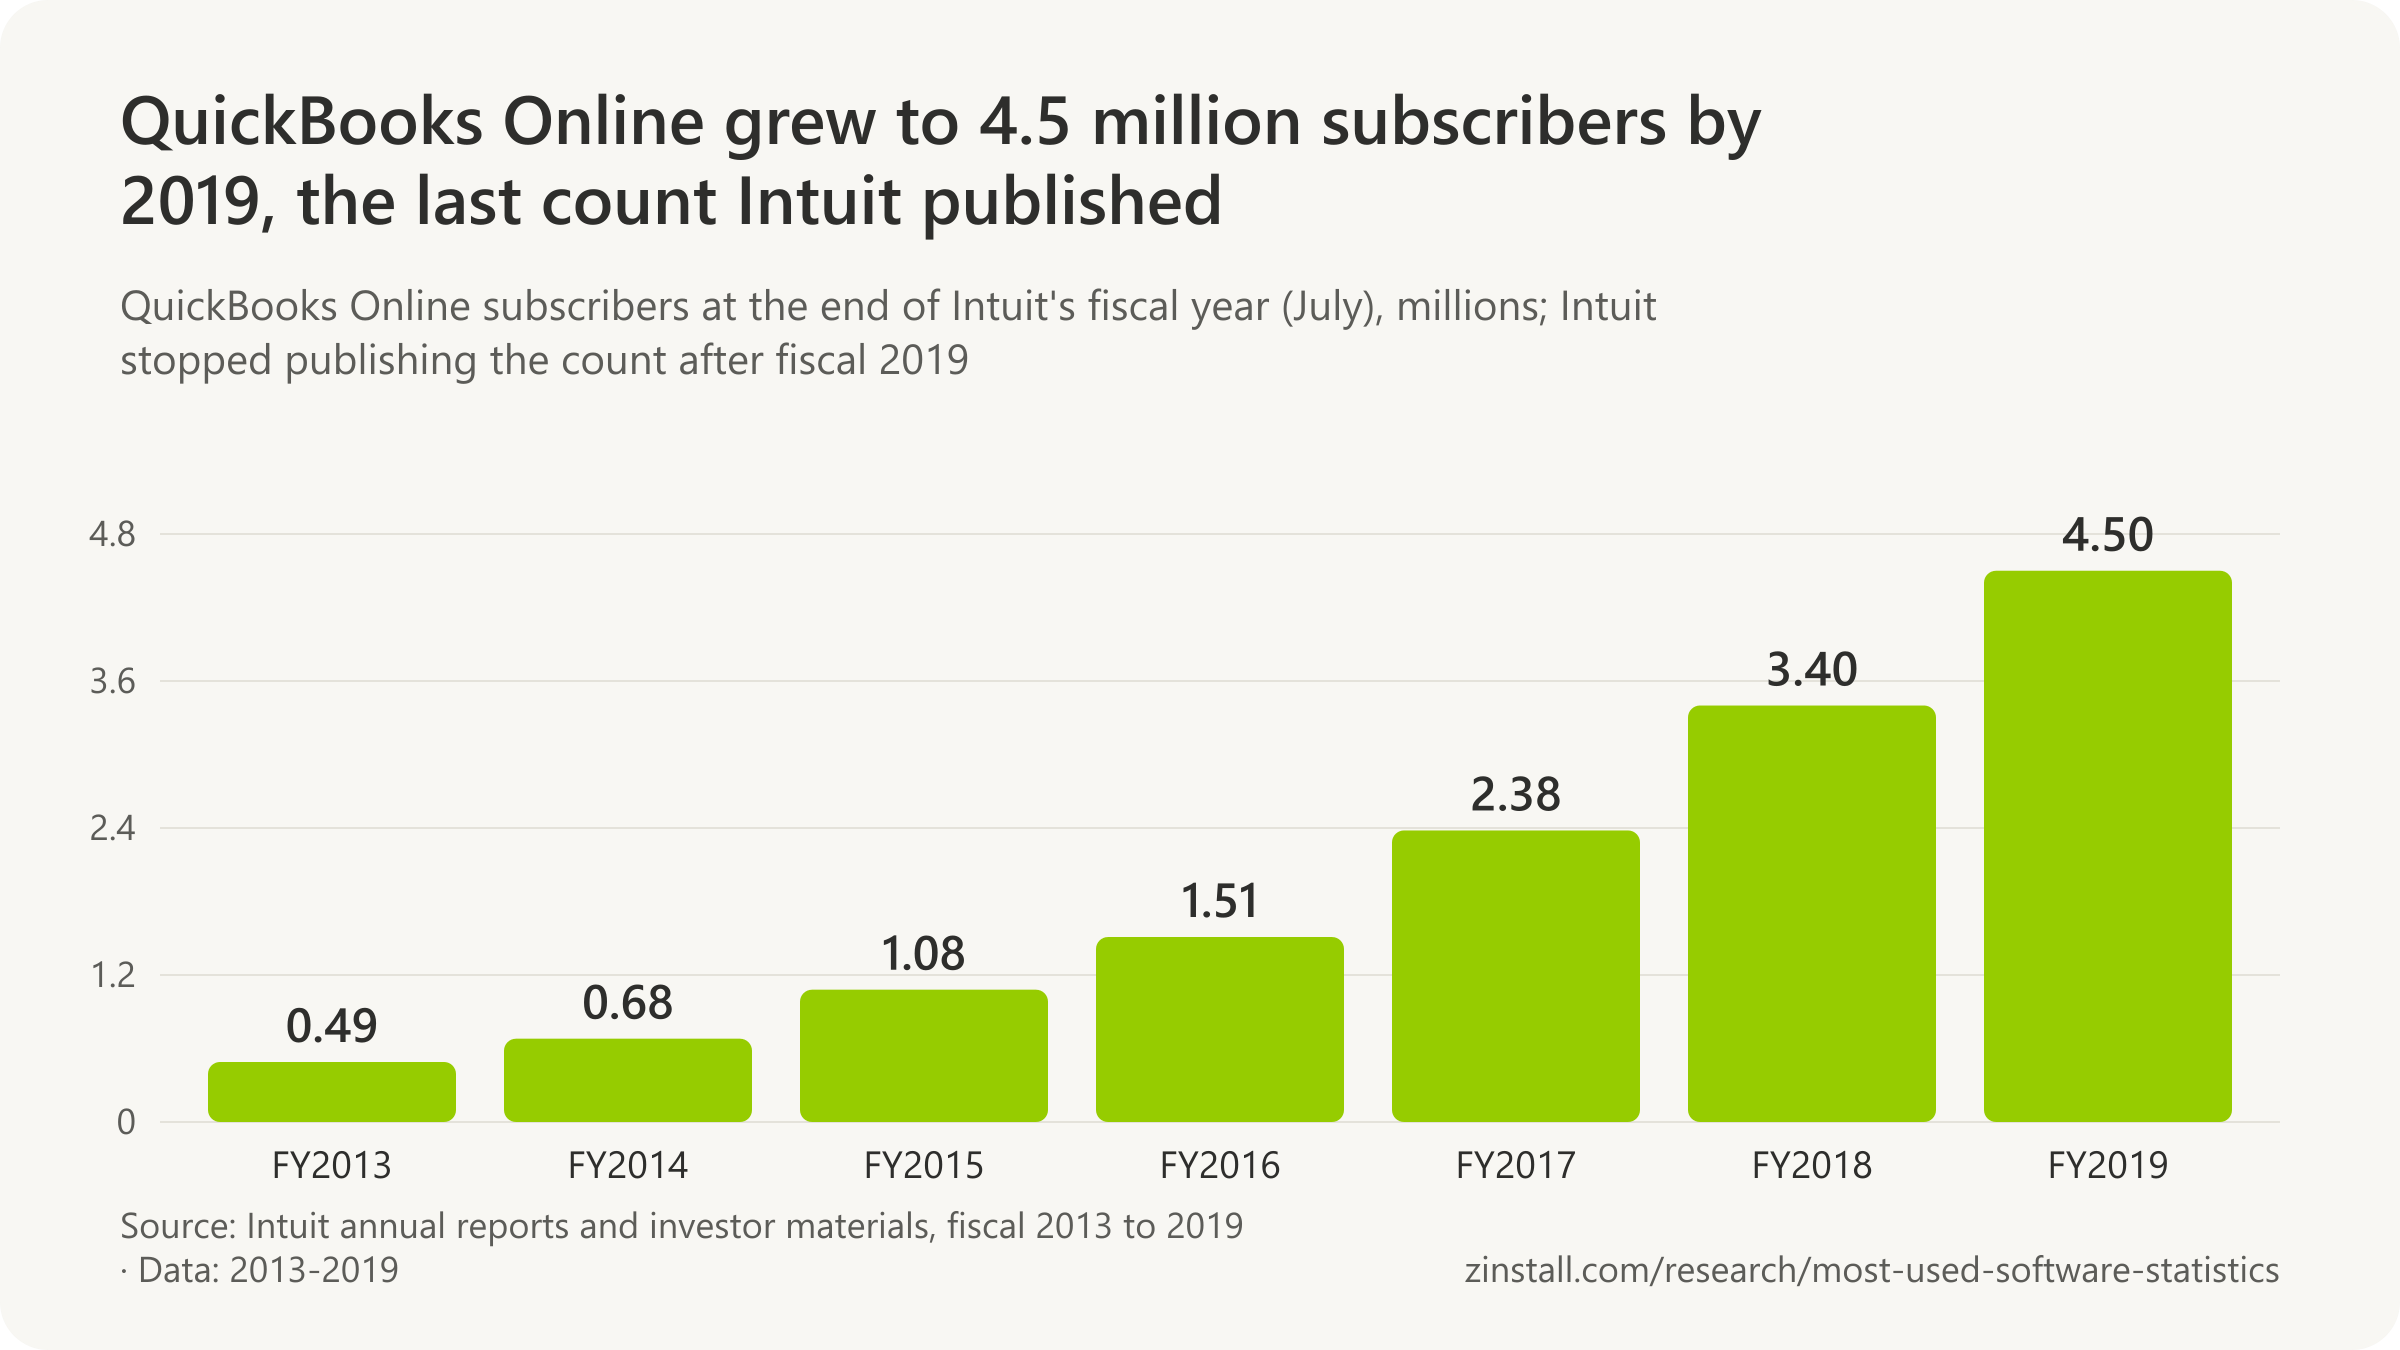
- 3% growth in Online Ecosystem paying customers (QuickBooks Online, QuickBooks Time, Mailchimp and standalone services) in the year to July 2026 is the only QuickBooks customer measure in Intuit's annual report, which gives no count (Intuit, 2026).
- Approximately 93 million consumers, small and mid-market businesses and accountants worldwide used Intuit's products (TurboTax, Credit Karma, QuickBooks, Mailchimp and others) in fiscal 2026, by Intuit's count in its annual report (Intuit, 2026).
- QuickBooks Desktop 2021 (Pro, Premier, Mac and Enterprise Solutions v21) was discontinued after 31 May 2024, ending payroll, online banking, live support and security updates for that version (Intuit, 2024).
- QuickBooks Desktop 2022 (Pro, Premier, Mac and Enterprise Solutions v22.0) was discontinued after 31 May 2025 (Intuit, 2025).
- QuickBooks Desktop 2023 (Pro Plus, Premier Plus, Mac Plus and Enterprise Solutions v23.0) was discontinued after 31 May 2026, leaving Desktop 2024 as the supported version (Intuit, 2026).
- QuickBooks Desktop Pro Plus, Premier Plus and Mac Plus stopped being sold to new US subscribers on 1 October 2024; existing subscribers can still renew and Desktop Enterprise is still sold (Intuit, 2024).
- 8.9 million paying customers used Intuit's online small-business products (QuickBooks Online, QuickBooks Time, Mailchimp and standalone services) at the end of July 2026, up 3% in a year, Intuit said on its earnings call (Intuit, 2026).
- $1.8 billion of revenue came from QuickBooks Desktop Accounting in Intuit's fiscal year to July 2026, up 8%, two years after new US Desktop Plus subscriptions stopped (Intuit, 2026).
Quicken
- More than 20 million customers have relied on Quicken over its 40-plus years, by Quicken Inc.'s own cumulative count, not a count of current users (Quicken, 2026).
- Over 20 million active users is how Quicken's own 40th-anniversary release of October 2023 described its base, a wording at odds with the same release's boilerplate of 20 million customers over 40 years (Quicken, 2023).
Sage and Peachtree
- No customer or subscriber count is published by Sage: its results for the year to September 2025 speak only of the millions of small and mid-sized businesses it serves, with 83% of revenue from software subscriptions (Sage, 2025).
- More than 6 million customers worldwide used Sage software in the year to September 2013, the last explicit customer total found in Sage's releases (Sage, 2013).
- Over 450,000 software subscription contracts worth £220 million a year were held by Sage customers at the end of September 2014, by Sage's annual report (Sage, 2014).
- Sage Peachtree became Sage 50 Accounting in the US with the 2013 version, released in May 2012 (CPA Practice Advisor, 2012).
Xero and FreshBooks

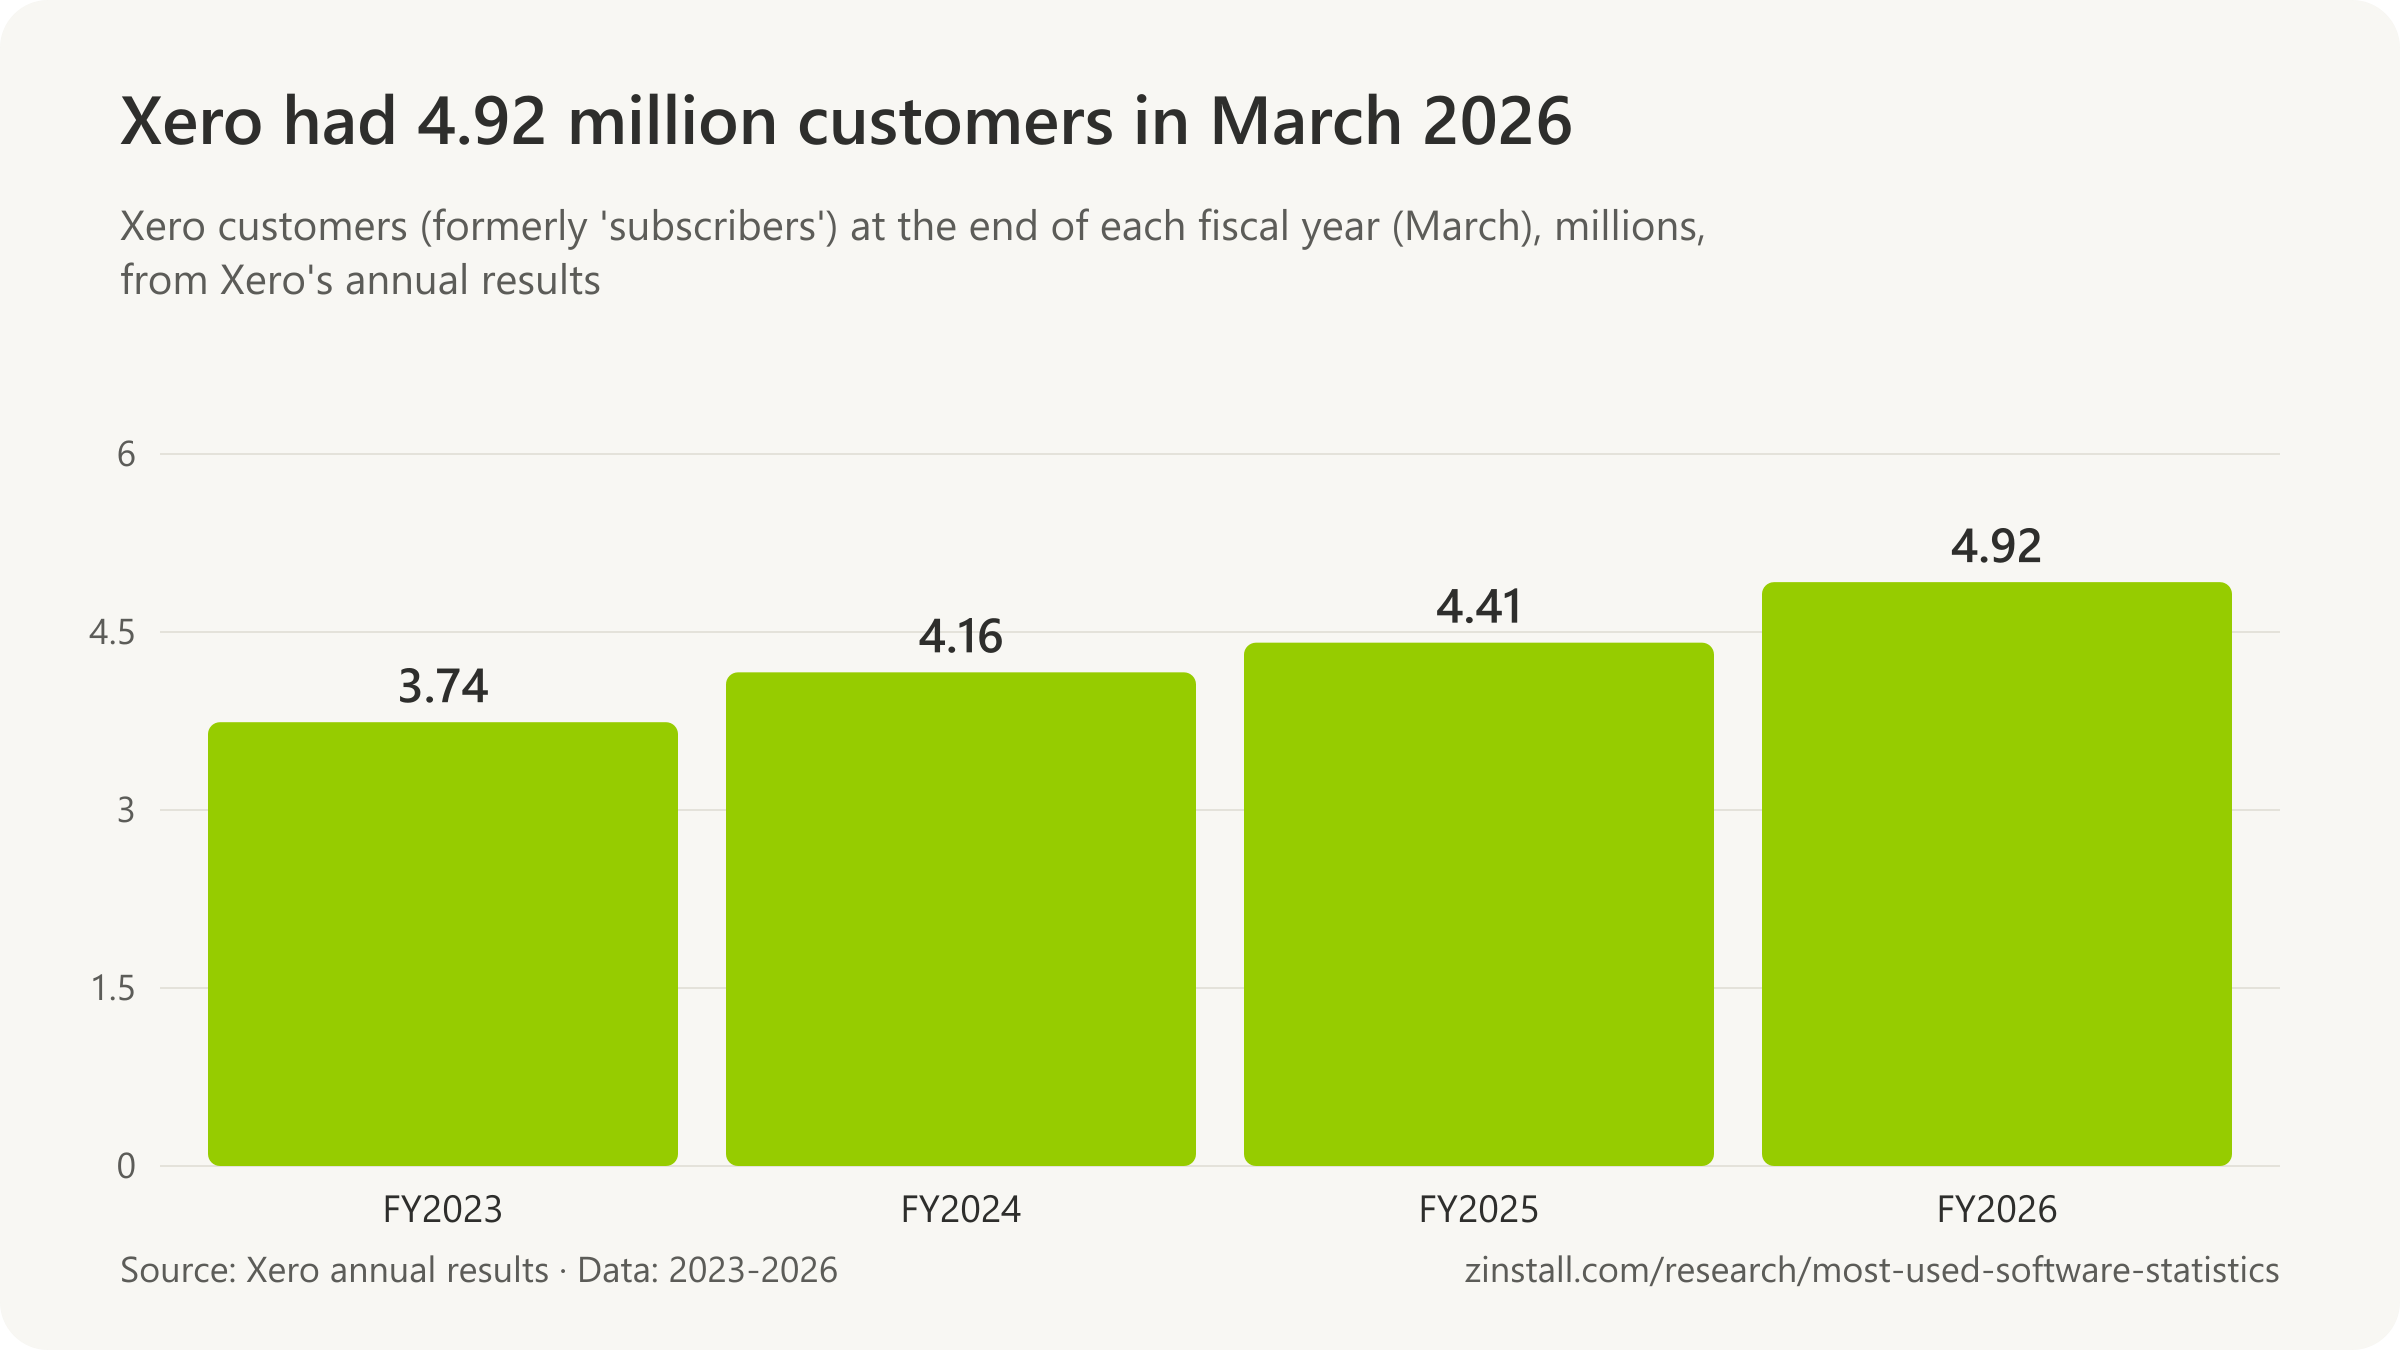
- 4.92 million customers (subscriptions) used Xero worldwide at 31 March 2026, up 11% in a year, with 2.8 million in Australia and New Zealand (Xero, 2026).
- 3.74 million Xero customers at March 2023 grew to 4.16 million (2024), 4.41 million (2025) and 4.92 million (2026), by Xero's FY26 results presentation (Xero, 2026).
- Over 30 million people worldwide have used FreshBooks since 2003, by FreshBooks' own cumulative claim on its website (FreshBooks, 2026).
Numbers in circulation
- 83,220 companies and a 37.49% share of the accounting category were attributed to QuickBooks by the technographics vendor 6sense in May 2025, a web-tracking estimate without a published method (6sense, 2025).
- Over 42 million QuickBooks users worldwide was claimed by a QuickBooks South Africa sales manager in September 2017, restating Intuit's company-wide count of 42 million customers across all its products (CFO South Africa, 2017).
Sources: Intuit (2013-2026); Internal Revenue Service (2019-2026); H&R Block (2022, 2026); Quicken Inc. (2023, 2026); The Sage Group plc (2013, 2014, 2025); CPA Practice Advisor; Xero Limited (2026); FreshBooks; ElectroIQ; 6sense; CFO South Africa
How many people use Photoshop, Acrobat, AutoCAD and VLC?
Acrobat, Express, Creative Cloud and Firefly together had more than 1 billion monthly users in mid-2026 (Adobe, 2026).

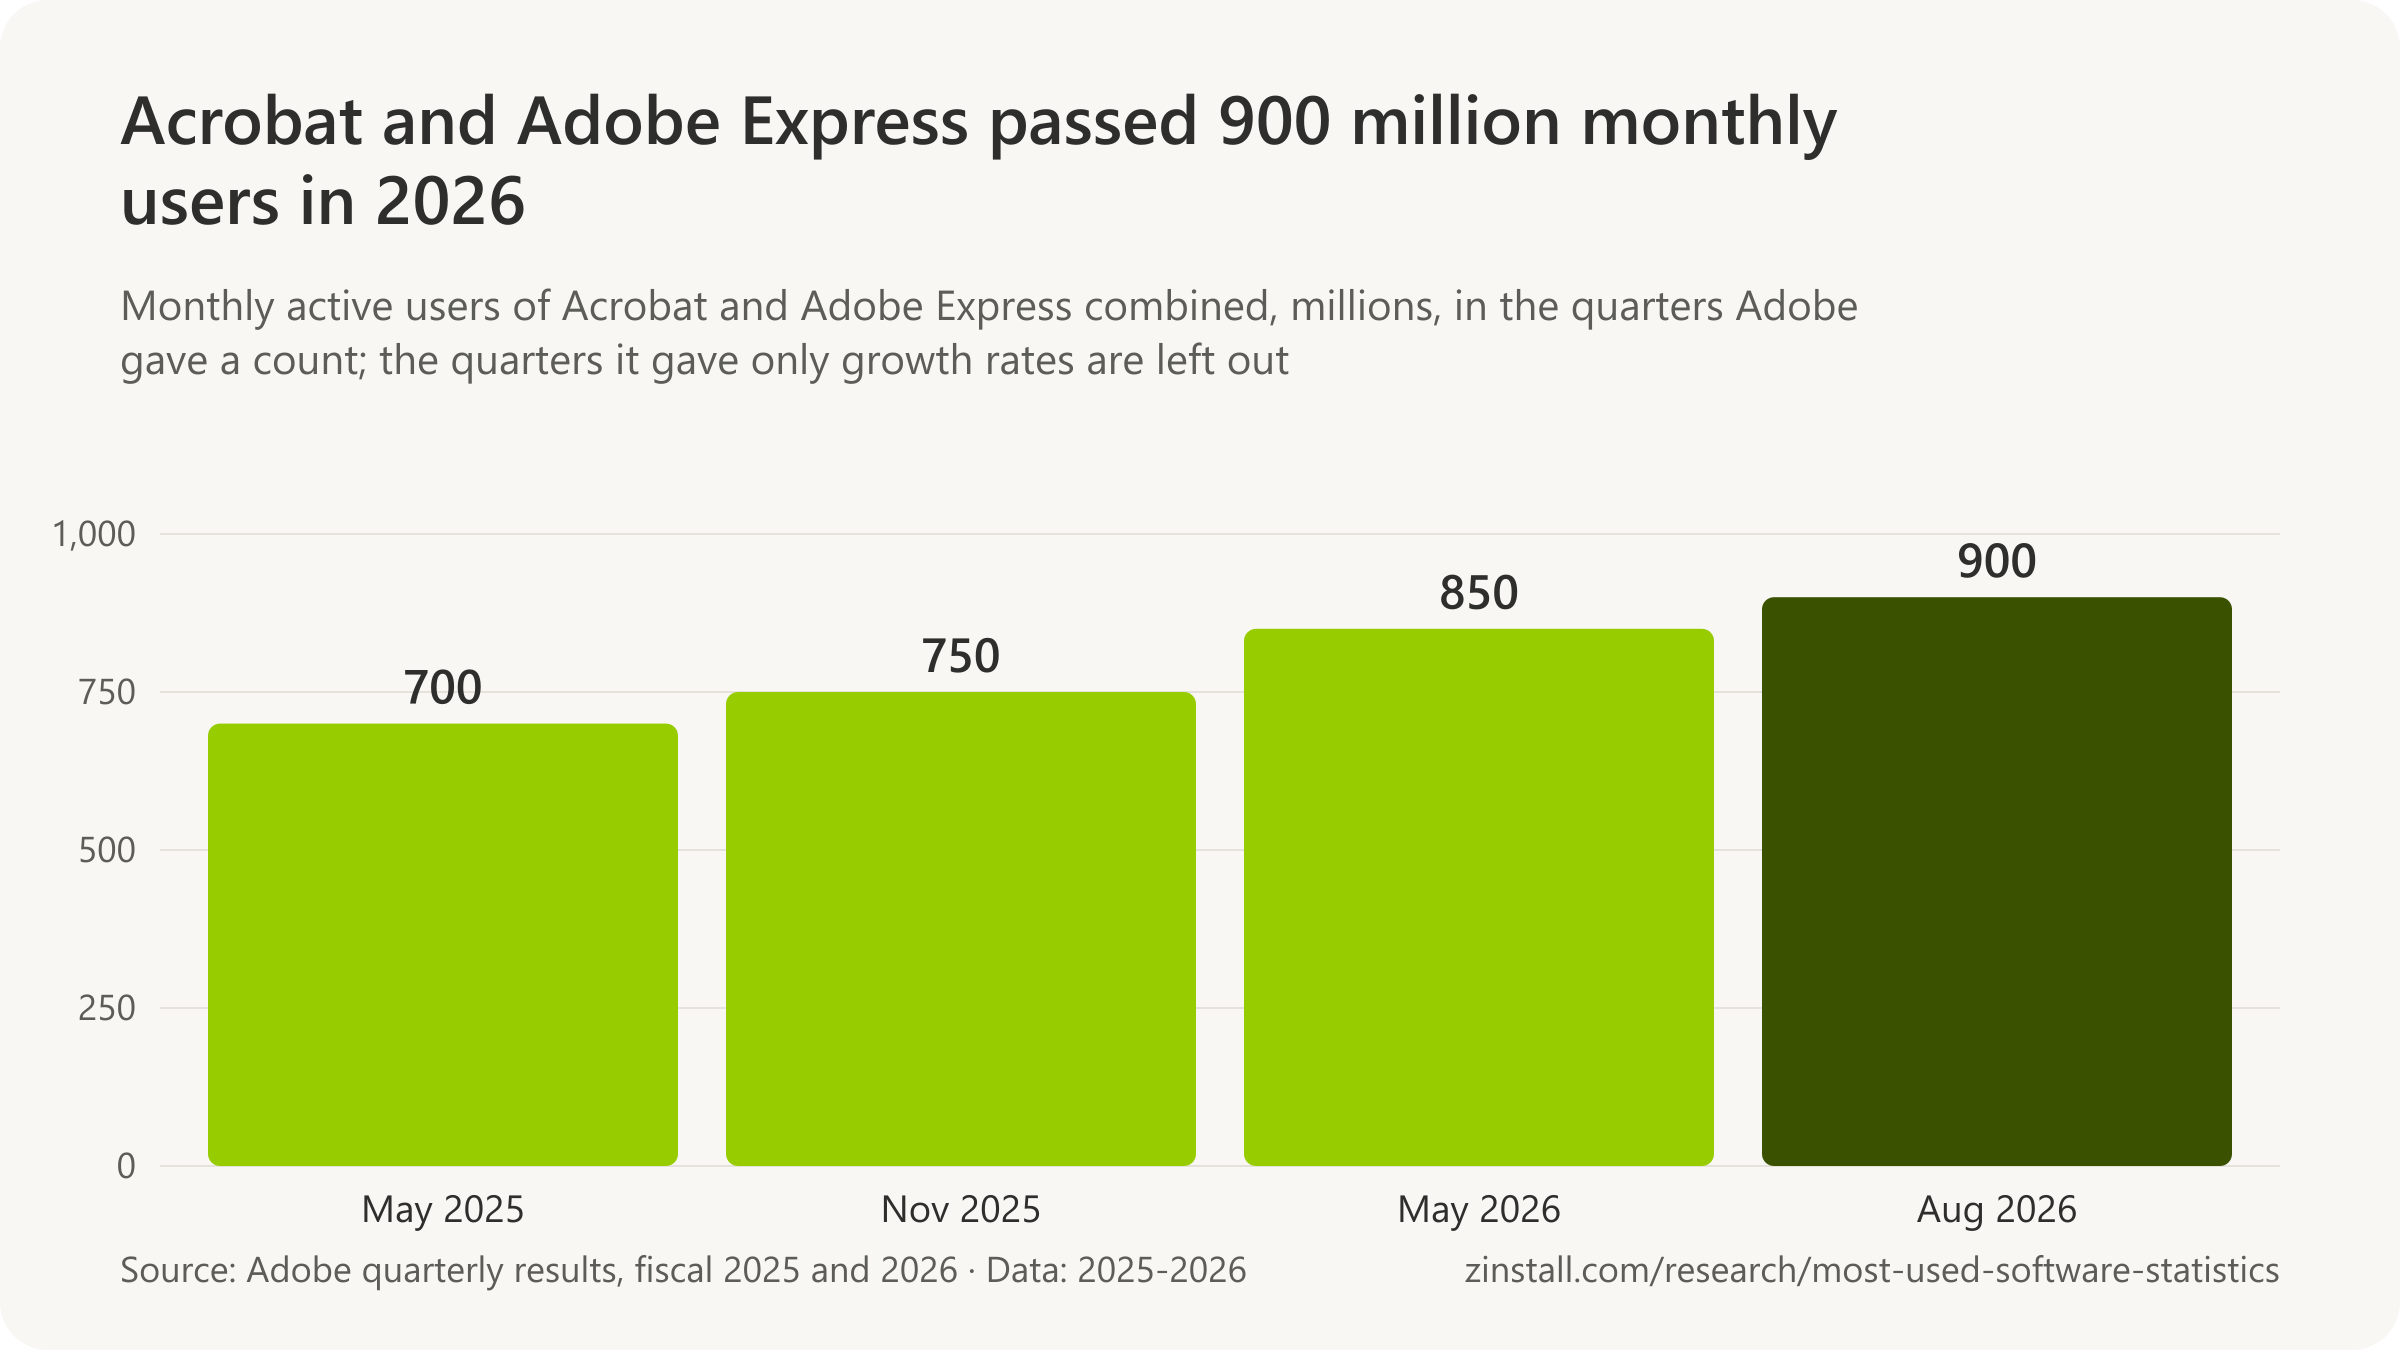
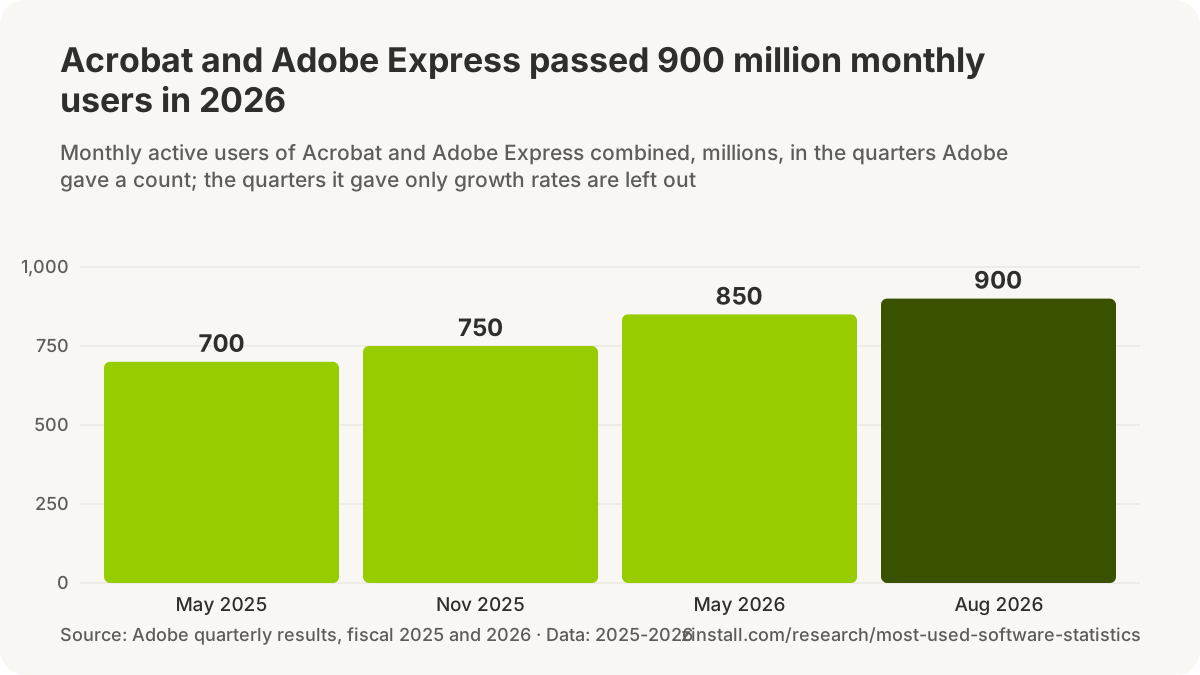
- Adobe's Acrobat and Express had more than 900 million monthly active users combined in August 2026.
- Adobe has never counted Photoshop users and last counted Creative Cloud subscriptions in 2015, at 6.2 million.
- Autodesk had 7.8 million paid subscriptions across all its software in January 2025, then stopped reporting the count.
- VLC media player has been downloaded 7.1 billion times since 2005.
- Canva had 260 million monthly users in 2025.
| Software, measure and date | Count |
|---|---|
| Canva: paid users, 2025 | over 31 million |
| Figma: monthly active users, March 2025 | more than 13 million |
| Pinnacle Studio: users, 2026 | 13+ million |
| CorelDRAW: users, 2015 | over 10 million |
| SolidWorks: users, 2026 | 8 million |
| MATLAB and Simulink: users, 2025 | over 5 million |
| Dragon Medical: physicians using it, 2021 | over 550,000 |
| Adobe's free creative apps: monthly active users, 2026 | over 100 million |
Sources: Adobe (2016, 2025, 2026); Autodesk, Inc.; VideoLAN; Canva; TechCrunch; Figma; Corel Corporation; Architosh; Dassault Systèmes; MathWorks; Nuance Communications
Moving these programs to a new computer: Photoshop · Lightroom · Adobe Acrobat · AutoCAD · CorelDRAW · Pinnacle Studio · iTunes · Picasa
More statistics (143)
Adobe and Autodesk report across their product families, not per program: Adobe counts monthly active users of Acrobat, Express and its other products together, and Autodesk counted subscriptions across all its software until 2025. Free and open-source programs publish downloads.
Photoshop and Lightroom
- Adobe publishes no count of Photoshop users: its results describe Photoshop only as a growth driver and fold the web and mobile versions into a combined creative freemium figure (Adobe, 2025).
- More than 500,000 photographers took part in the public beta of Photoshop Lightroom in 2006, Adobe said at its launch in January 2007, the last Lightroom-only user figure Adobe has published (Adobe, 2007).
- 58% of 657 photographers who answered a Shotkit survey used Adobe Lightroom to edit photos, a self-selected online sample of mostly amateurs (Shotkit, 2025).
Adobe: Acrobat, Express and Creative Cloud

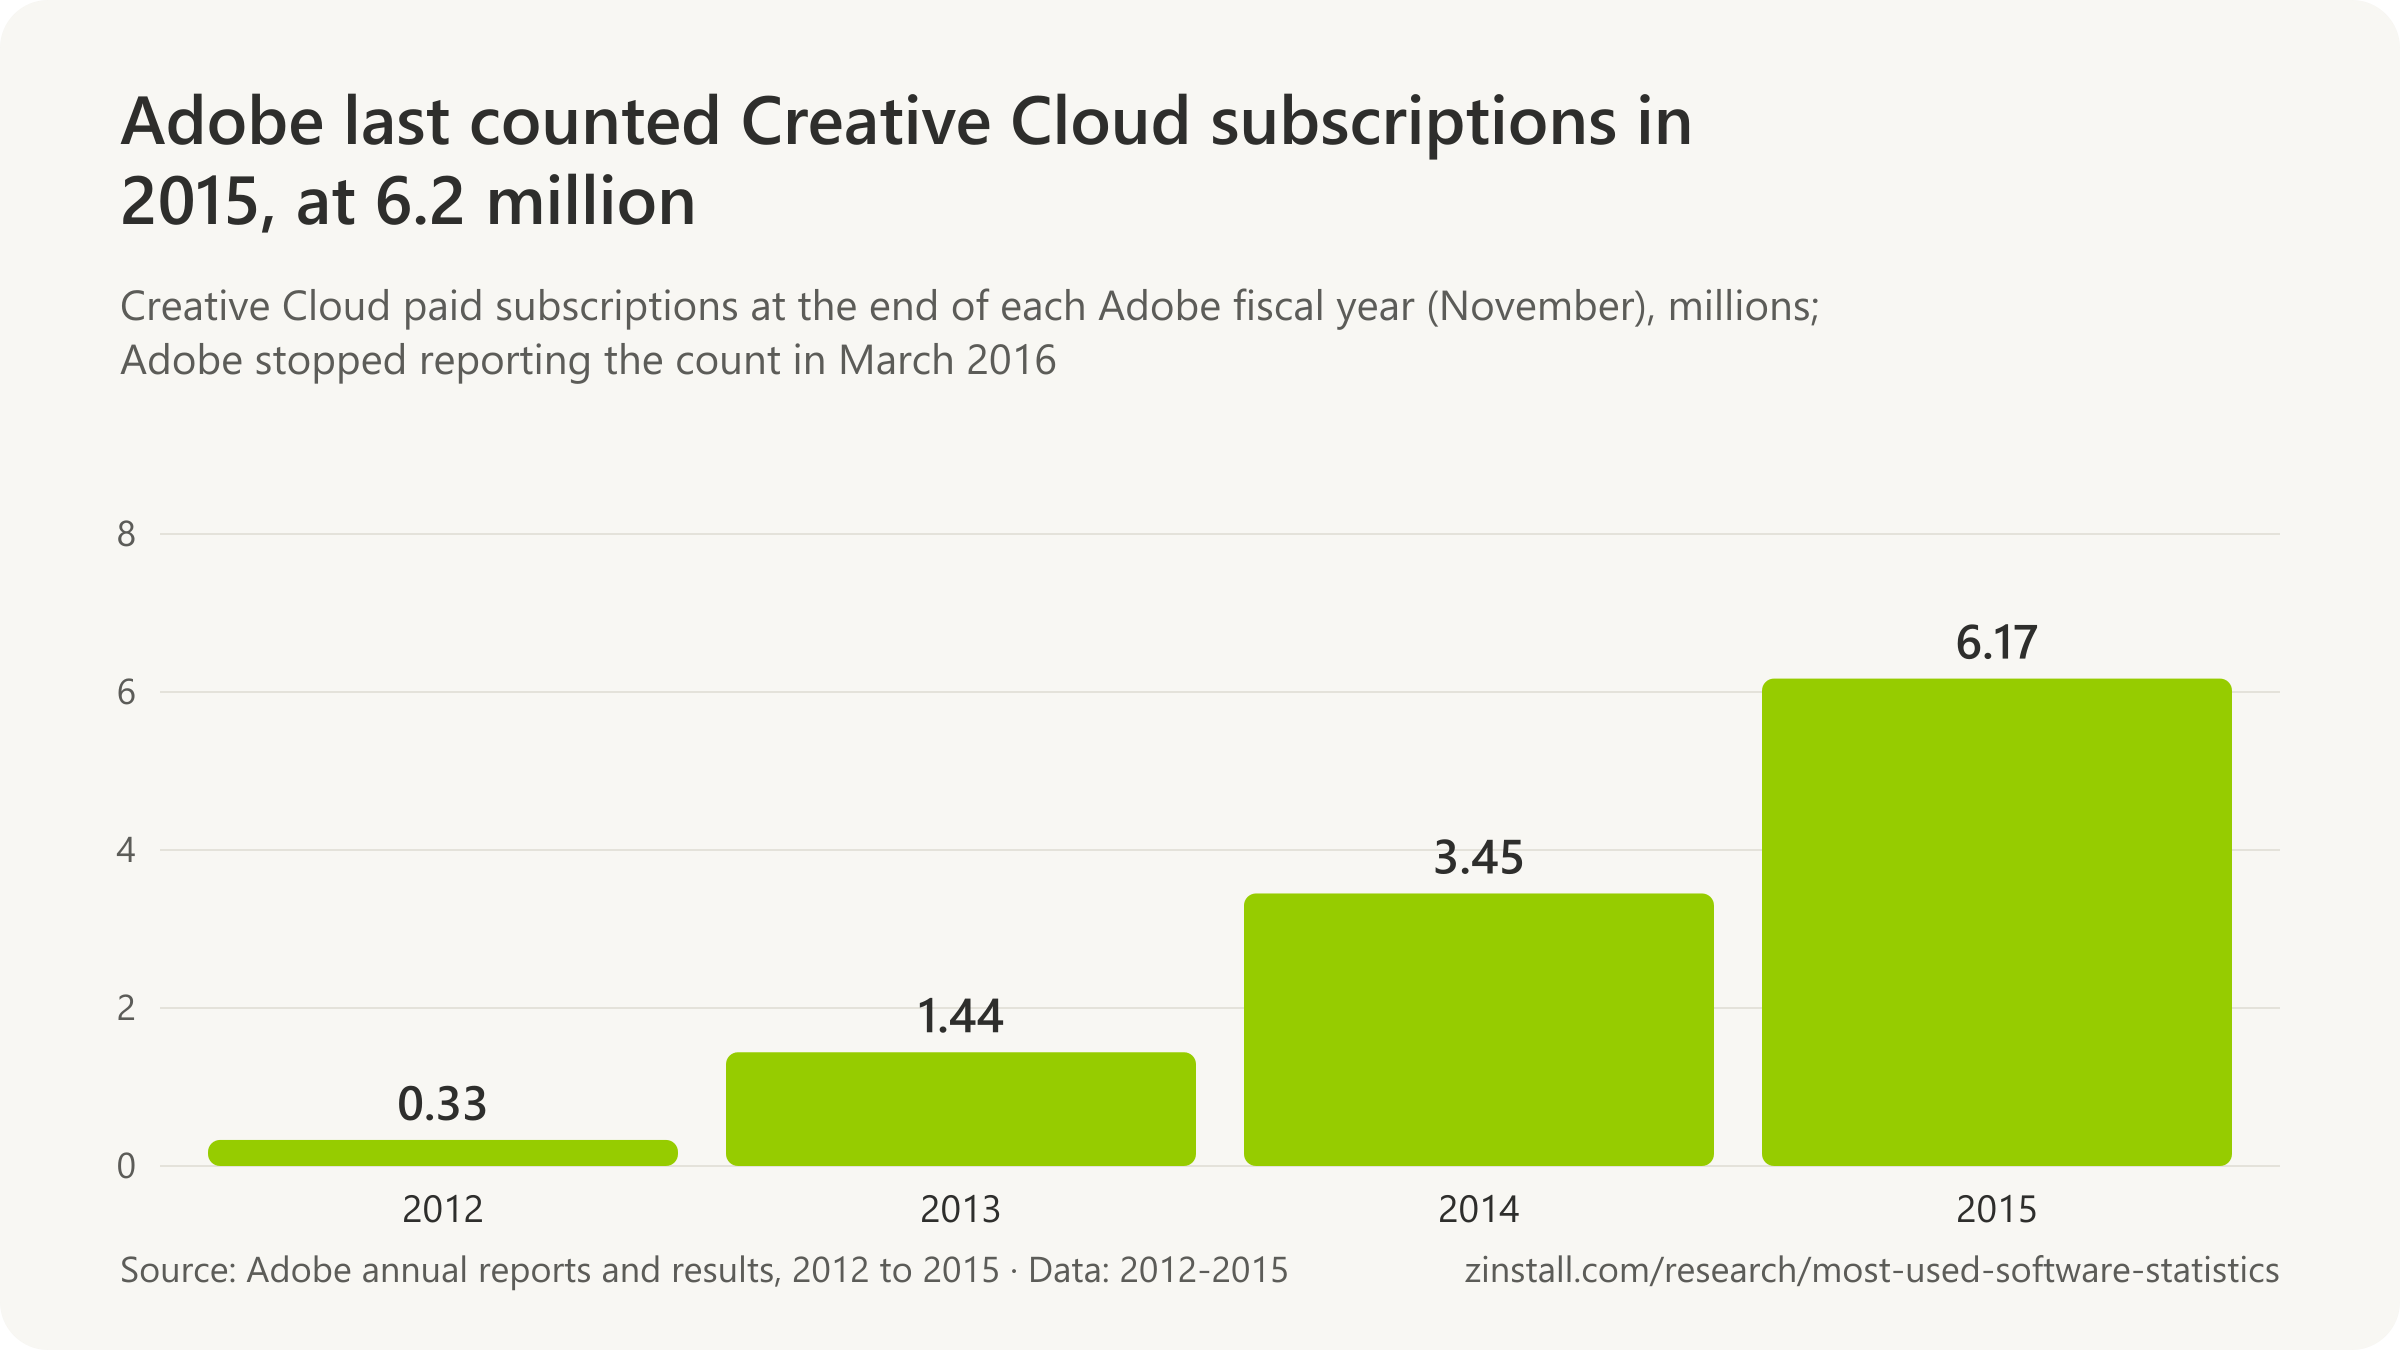
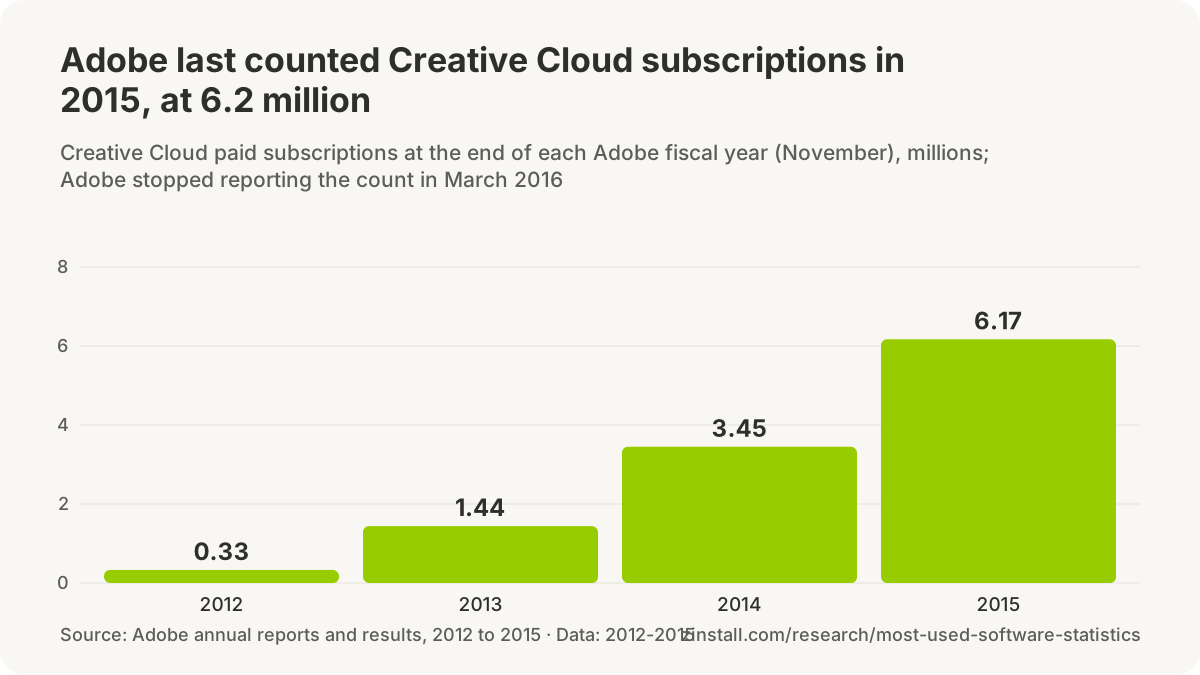
- Over 1 billion monthly active users across Adobe's creativity and productivity products (Acrobat, Express, Creative Cloud and Firefly) in the quarter to 28 August 2026, Adobe said, a count that grew more than 20% in a year (Adobe, 2026).
- Over 900 million monthly active users of Adobe Acrobat and Adobe Express combined in the quarter to 28 August 2026, up more than 25% in a year, Adobe said in its earnings call script (Adobe, 2026).
- Over 100 million monthly active users of Adobe's free creative offerings (Firefly, Express and the web and mobile versions of Photoshop, Lightroom and Premiere) in the quarter to 28 August 2026, up more than 70% in a year, Adobe said (Adobe, 2026).
- Over 850 million monthly active users of Adobe Acrobat and Adobe Express combined in the quarter to 29 May 2026, up about 20% in a year, Adobe said (Adobe, 2026).
- Over 90 million monthly active users of Adobe's free creative offerings (web and mobile Firefly, Express, Premiere, Photoshop and Lightroom) in the quarter to 29 May 2026, up from 50 million a year earlier, Adobe said (Adobe, 2026).
- Over 850 million monthly active users of Adobe Acrobat, Creative Cloud, Express and Firefly together in the quarter to 27 February 2026, up 17% in a year, Adobe said (Adobe, 2026).
- Over 80 million monthly active users of Adobe's free creative offerings (web and mobile Firefly, Express, Premiere, Photoshop and Lightroom) in the quarter to 27 February 2026, up 50% in a year, Adobe said (Adobe, 2026).
- Over 750 million monthly active users of Adobe Acrobat and Adobe Express combined in the quarter to 28 November 2025, up 20% in a year, Adobe said (Adobe, 2025).
- Over 70 million monthly active users of Adobe's free creative offerings (Firefly, Express, Premiere mobile and others) in the quarter to 28 November 2025, up more than 35% in a year, Adobe said (Adobe, 2025).
- Over 700 million monthly active users of Adobe Acrobat and Adobe Express combined in the quarter to 30 May 2025, with growth above 25% in a year, Adobe said (Adobe, 2025).
- More than 650 million monthly active users of Adobe Acrobat, Adobe said in February 2025, its latest Acrobat-only figure (Adobe, 2025).
- Over 100 million monthly active users of Adobe Acrobat on mobile devices in the quarter to 1 December 2023, Adobe said (Adobe, 2023).
- More than 200 million copies of the free Acrobat Reader had been distributed by early 2001, Adobe said in its annual report for fiscal 2000 (Adobe, 2001).
- More than 500 million copies of the free Acrobat Reader had been distributed by early 2003, Adobe said in its annual report for fiscal 2002, a figure it then repeated unchanged until 2008 (Adobe, 2003).
- Hundreds of millions of people used the free Adobe Reader, Adobe said in its annual report for fiscal 2012, without giving a number (Adobe, 2013).
- 326,000 paid Creative Cloud subscriptions at the end of Adobe's fiscal 2012 (30 November 2012), the first year-end count Adobe gave after launching Creative Cloud (Adobe, 2012).
- 1.4 million paid Creative Cloud subscriptions at the end of Adobe's fiscal 2013 (29 November 2013), Adobe said (Adobe, 2013).
- 3.5 million paid Creative Cloud subscriptions at the end of Adobe's fiscal 2014 (28 November 2014), up 140% in a year, Adobe said in its annual report (Adobe, 2015).
- 6.2 million paid Creative Cloud subscriptions at the end of Adobe's fiscal 2015 (27 November 2015), the last subscription count Adobe has disclosed (Adobe, 2016).
- Adobe stopped reporting its number of paid Creative Cloud subscriptions in March 2016: from its first-quarter fiscal 2016 report it measured Creative Cloud by recurring revenue only, and no count has been published since (Adobe, 2016).
- Adobe Express's monthly active users tripled in the year to February 2026, Adobe said, without giving a number; Adobe reports Express users only combined with Acrobat, at over 900 million in August 2026 (Adobe, 2026).
- $4.65 billion of subscription revenue came from Adobe's Creative and Marketing Professionals customers (Creative Cloud, Firefly and its marketing products) in the quarter to 28 August 2026, the closest Creative Cloud measure Adobe still reports besides users of its free apps (Adobe, 2026).
Canva, Figma and GIMP

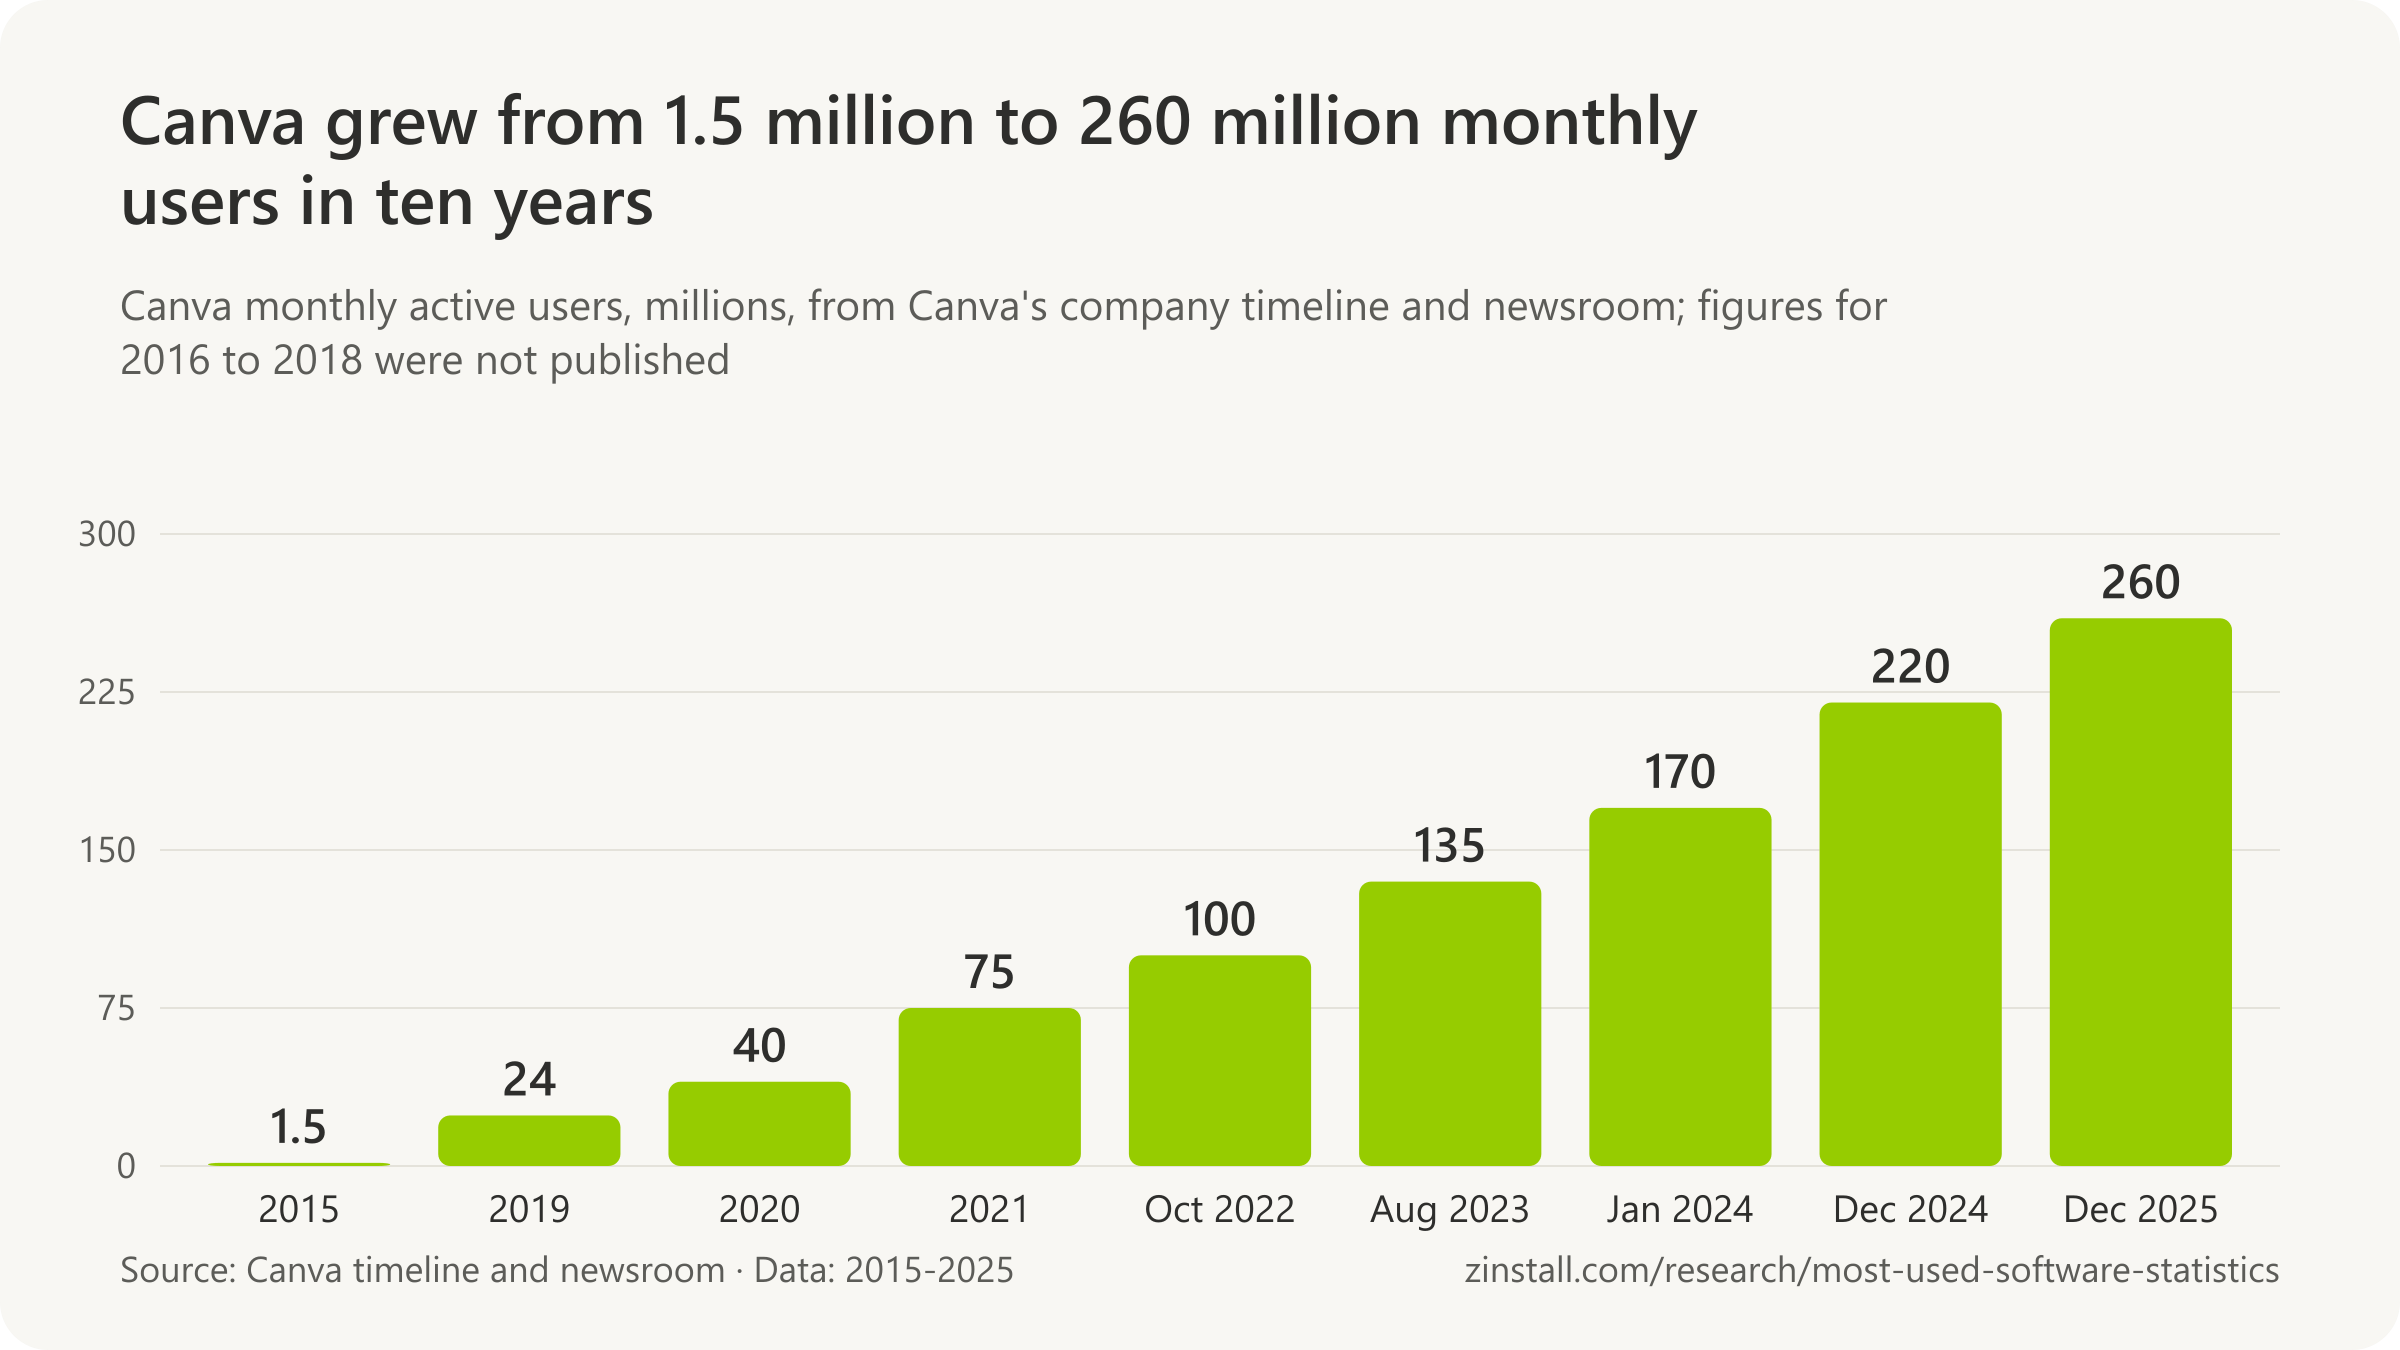
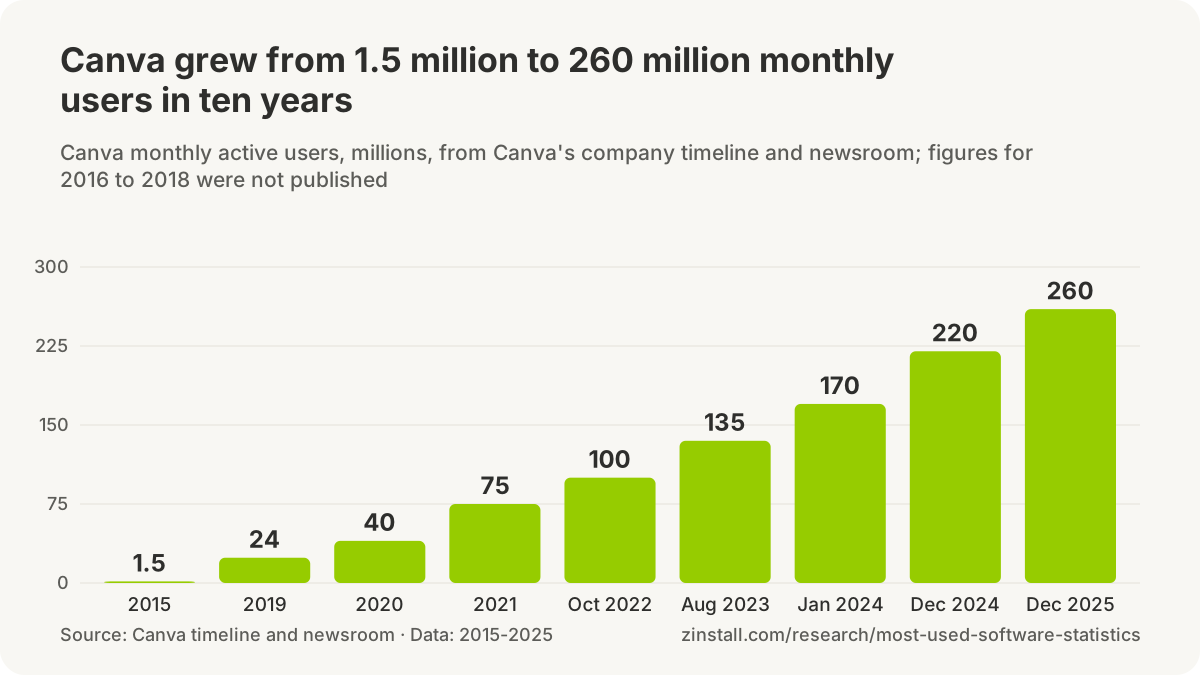
- More than 265 million monthly active users of Canva worldwide at the end of 2025, up 20% in a year, the company told TechCrunch (TechCrunch, 2026).
- Over 31 million paid users of Canva at the end of 2025, against more than 265 million monthly users, the company told TechCrunch (TechCrunch, 2026).
- 260 million people used Canva every month in 2025, Canva said in its year-in-review (Canva, 2025).
- More than 220 million people used Canva in December 2024, up from 200 million in October 2024, Canva said (Canva, 2024).
- More than 170 million people worldwide were using Canva in January 2024, Canva said (Canva, 2024).
- 135 million monthly users of Canva in August 2023, its tenth anniversary, Canva said (Canva, 2023).
- More than 100 million people used Canva each month by October 2022, Canva announced (Canva, 2022).
- More than 60 million monthly active users of Canva in 190 countries in September 2021, Canva said when it announced its US$40 billion valuation (Canva, 2021).
- 24 million people used Canva each month in 2019, by Canva's own timeline (Canva, 2023).
- 40 million people used Canva each month in 2020, by Canva's own timeline (Canva, 2023).
- More than 75 million people used Canva each month in 2021, by Canva's own timeline (Canva, 2023).
- Over 1.5 million people used Canva each month in 2015, by Canva's own timeline (Canva, 2023).
- More than 13 million monthly active users of Figma in the first quarter of 2025, two-thirds of them not designers, Figma said in its IPO prospectus, its only published user count (Figma, 2025).
- Approximately 450,000 paid customer accounts used Figma at 31 March 2025, Figma said in its IPO prospectus (Figma, 2025).
- Figma published no new monthly active user count in its 2025 annual report, saying only that non-designers made up about two-thirds of its monthly active users in the last quarter of 2025 (Figma, 2026).
- 15,964 business customers paid Figma more than $10,000 a year at 30 June 2026, up 34% in a year, Figma said (Figma, 2026).
- 13,861 business customers paid Figma more than $10,000 a year at the end of 2025, up from 10,517 a year earlier, Figma said in its annual report (Figma, 2026).
- About 3.7 million known downloads of GIMP 3.2.4 in the 43 days after its release on 19 April 2026, more than 80,000 a day, the GIMP project said (GIMP, 2026).
- More than 2.7 million downloads of GIMP 3.2.4 for Windows (installer and Microsoft Store) in its first 43 days, against nearly 350,000 for macOS, the GIMP project said (GIMP, 2026).
- Over 7 million downloads of GIMP 3 in the eight weeks after its release on 16 March 2025, the GIMP project said (GIMP, 2025).
- About 10 million known downloads of GIMP 3.0.2, the version current from late March to mid-May 2025, the GIMP project said (GIMP, 2025).
- 3.9 million installs of GIMP from Flathub, the main Linux Flatpak app store, by Flathub's count on 14 October 2026, with 61,369 in the last month (Flathub, 2026).
AutoCAD and other Autodesk software

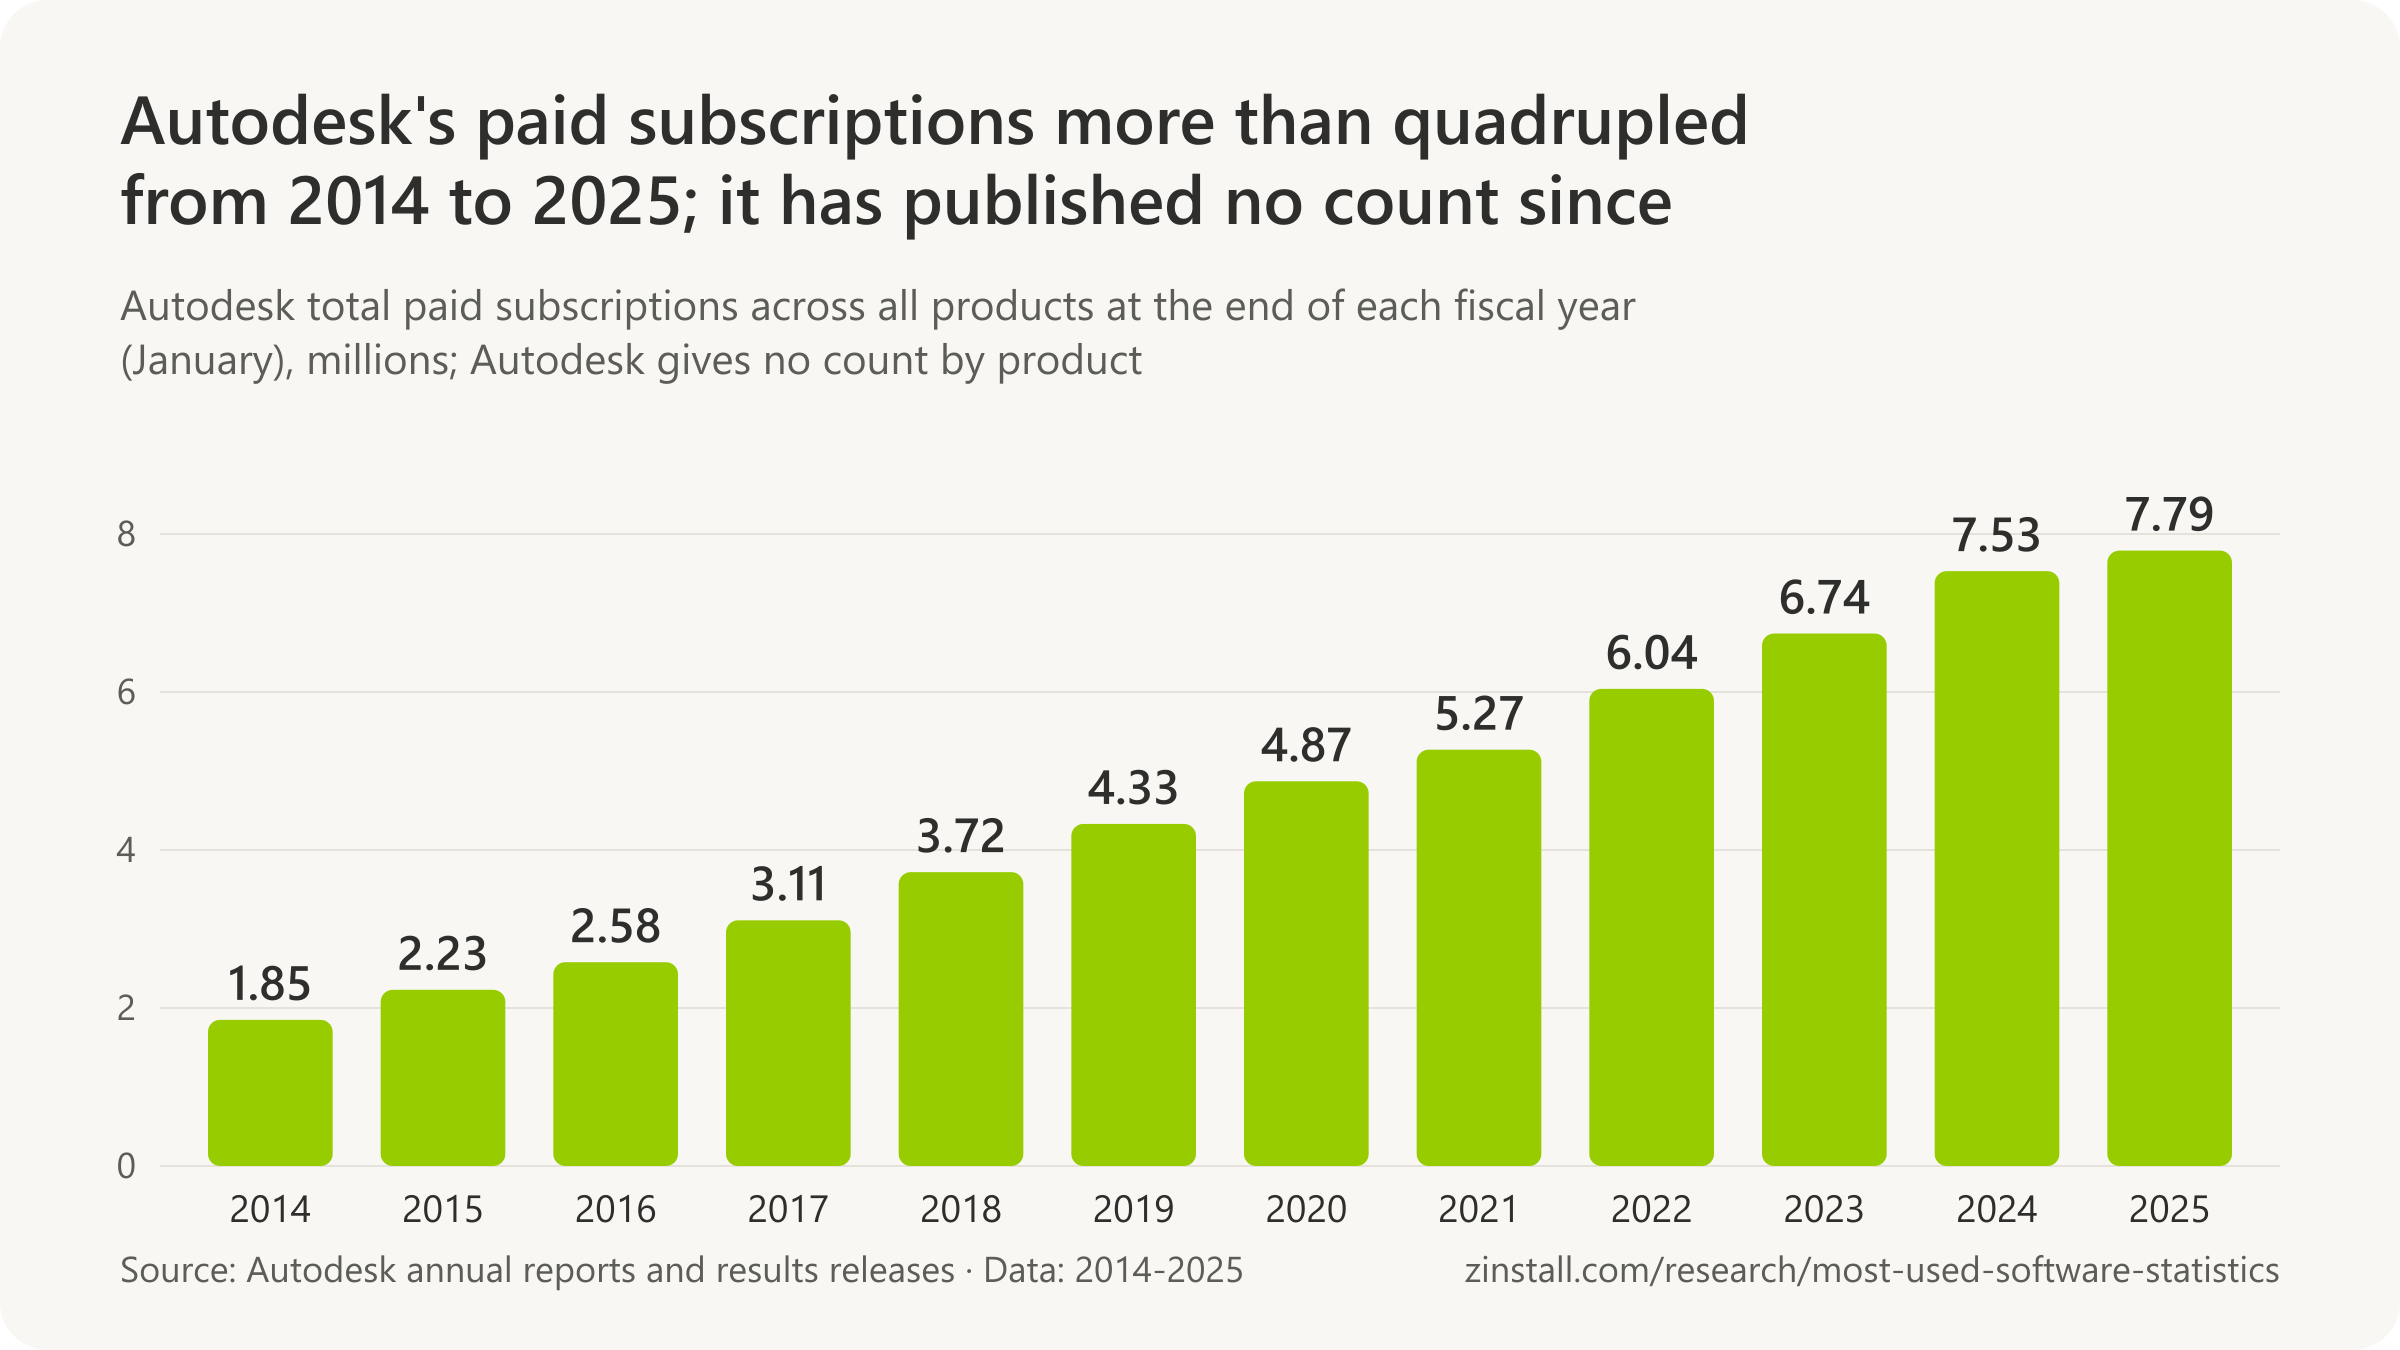
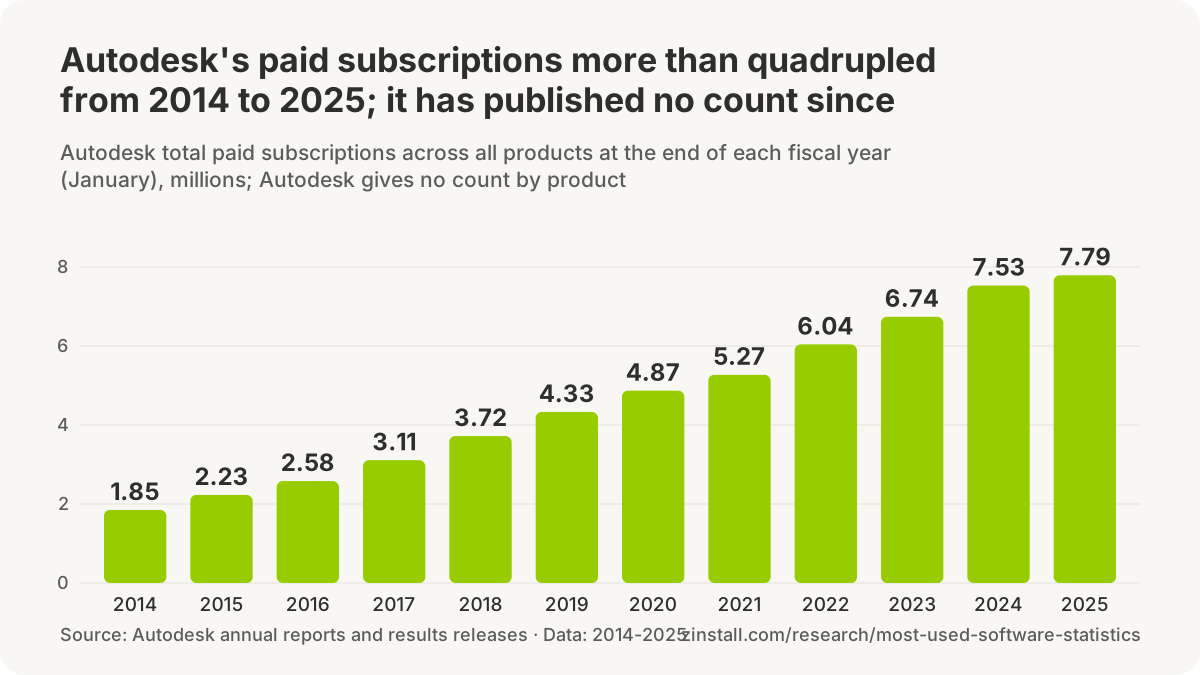
- Autodesk published no subscription count for fiscal 2026: its results of 26 February 2026 still name subscriptions as a key metric but give no number, so the last count remains 7.8 million paid subscriptions at January 2025 (Autodesk, 2026).
- Autodesk stopped reporting its subscription count every quarter from fiscal 2020, which began in February 2019, it said in its fiscal 2019 results, and gave only a year-end total after that (Autodesk, 2019).
- Nearly 1.5 million users were enrolled in Autodesk's Subscription Program (paid maintenance contracts) worldwide at the end of January 2008, Autodesk said in its fiscal 2008 annual report (Autodesk, 2008).
- About 1.7 million users were enrolled in Autodesk's maintenance Subscription Program worldwide at the end of January 2009, Autodesk said in its fiscal 2009 annual report (Autodesk, 2009).
- About 2.2 million users were enrolled in Autodesk's maintenance Subscription Program worldwide at the end of January 2010, including 0.6 million educational seats first counted that year, Autodesk said in its fiscal 2010 annual report (Autodesk, 2010).
- About 2.9 million users were enrolled in Autodesk's maintenance Subscription Program worldwide at the end of January 2011, Autodesk said in its fiscal 2011 annual report (Autodesk, 2011).
- About 3.2 million users were enrolled in Autodesk's maintenance Subscription Program worldwide at the end of January 2012, the last such figure Autodesk gave, in its fiscal 2012 annual report (Autodesk, 2012).
- 8 million licences of Autodesk software had been sold worldwide by March 2007, Autodesk said in a press release in which its chief executive called them eight million users (Autodesk, 2007).
- 6 million users of AutoCAD and AutoCAD LT combined worldwide in March 2005, about 600,000 of them on subscription, Autodesk's then chief operating officer Carl Bass told InfoWorld (InfoWorld, 2005).
- 10 to 12 million copies of AutoCAD were in use worldwide in 2019, about three quarters of them pirated, by Autodesk executives' account as reported by CAD analyst Ralph Grabowski (Jon Peddie Research, 2019).
- More than 6 million people were actively using pirated Autodesk software in early 2017, Autodesk co-CEO Andrew Anagnost said on the company's March 2017 earnings call, as reported by Engineering.com (Engineering.com, 2017).
- Nearly 40 million education users of Autodesk's Tinkercad and Fusion 360 alone worldwide by early 2021, Autodesk said in its fiscal 2021 fourth-quarter earnings presentation (Autodesk, 2021).
- 25% of Autodesk's total net revenue in fiscal 2026 (the year to January 2026) came from AutoCAD and AutoCAD LT family products, not counting collections that include them, Autodesk said in its 10-K (Autodesk, 2026).
- Over 200 million people worldwide used Autodesk software, free apps included, Autodesk said in its corporate fact sheet of early 2018, when it had 3.7 million paid subscriptions (Autodesk, 2018).
SolidWorks
- 8 million people used SOLIDWORKS and its 3DEXPERIENCE platform tools worldwide in January 2026, by Dassault Systèmes' count, SOLIDWORKS chief executive Manish Kumar said ahead of 3DEXPERIENCE World 2026 (Dassault Systèmes, 2026).
- 7 million users of SOLIDWORKS worldwide in early 2023, Dassault Systèmes said in its German-language review of 3DEXPERIENCE World 2023 (Dassault Systèmes, 2023).
- Over 6 million people in the SOLIDWORKS user community worldwide in 2020, by Dassault's SOLIDWORKS unit's count on its SOLIDWORKS Live channel (Dassault Systèmes SOLIDWORKS, 2020).
- More than 3.1 million users of SOLIDWORKS worldwide in September 2016, Dassault Systèmes said when it launched SOLIDWORKS 2017 (Dassault Systèmes, 2016).
- 2.7 million users of SOLIDWORKS worldwide in October 2015, Dassault Systèmes said when it launched SOLIDWORKS 2016 (Dassault Systèmes, 2015).
- 2 million licences of SolidWorks had been sold worldwide by January 2013, Dassault Systèmes said (Dassault Systèmes, 2013).
- 2 million SOLIDWORKS licences had been installed at schools and universities worldwide by February 2015, Dassault Systèmes said (Dassault Systèmes, 2015).
- Over 2.3 million active users of SOLIDWORKS at over 234,800 companies in 80 countries in October 2016, the SOLIDWORKS company blog said (Dassault Systèmes SOLIDWORKS, 2016).
- 45 million users and over 390,000 customers of Dassault Systèmes software across all its brands (CATIA, SOLIDWORKS and others) worldwide in 2025, plus 12 million students, Dassault Systèmes said in its 2025 Universal Registration Document (Dassault Systèmes, 2026).
CorelDRAW, WordPerfect and Pinnacle Studio
- More than 2.5 million paying customer relationships across all its brands (Parallels, CorelDRAW, MindManager, WinZip) in more than 130 countries in the year to September 2022, Corel said when it renamed itself Alludo (Alludo, 2022).
- Over 90 million knowledge workers worldwide used Corel's software (CorelDRAW, Parallels, WinZip and other brands) in 2019, KKR and Corel said when KKR bought Corel (Corel, 2019).
- Over 100 million people actively used Corel software (CorelDRAW, WordPerfect, WinZip, WinDVD and others) in over 75 countries, by Corel's estimate in its last annual report as a listed company (Corel, 2009).
- Over 10 million people used CorelDRAW worldwide in 2015, over 4 million of them on the current version, a Corel senior product manager told Architosh, the last specific CorelDRAW user figure found (Architosh, 2015).
- More than 13 million users of Pinnacle Studio video-editing software, Corel claims on its Pinnacle post-installation page, a claim unchanged since at least November 2022 (Corel, 2026).
VLC media player

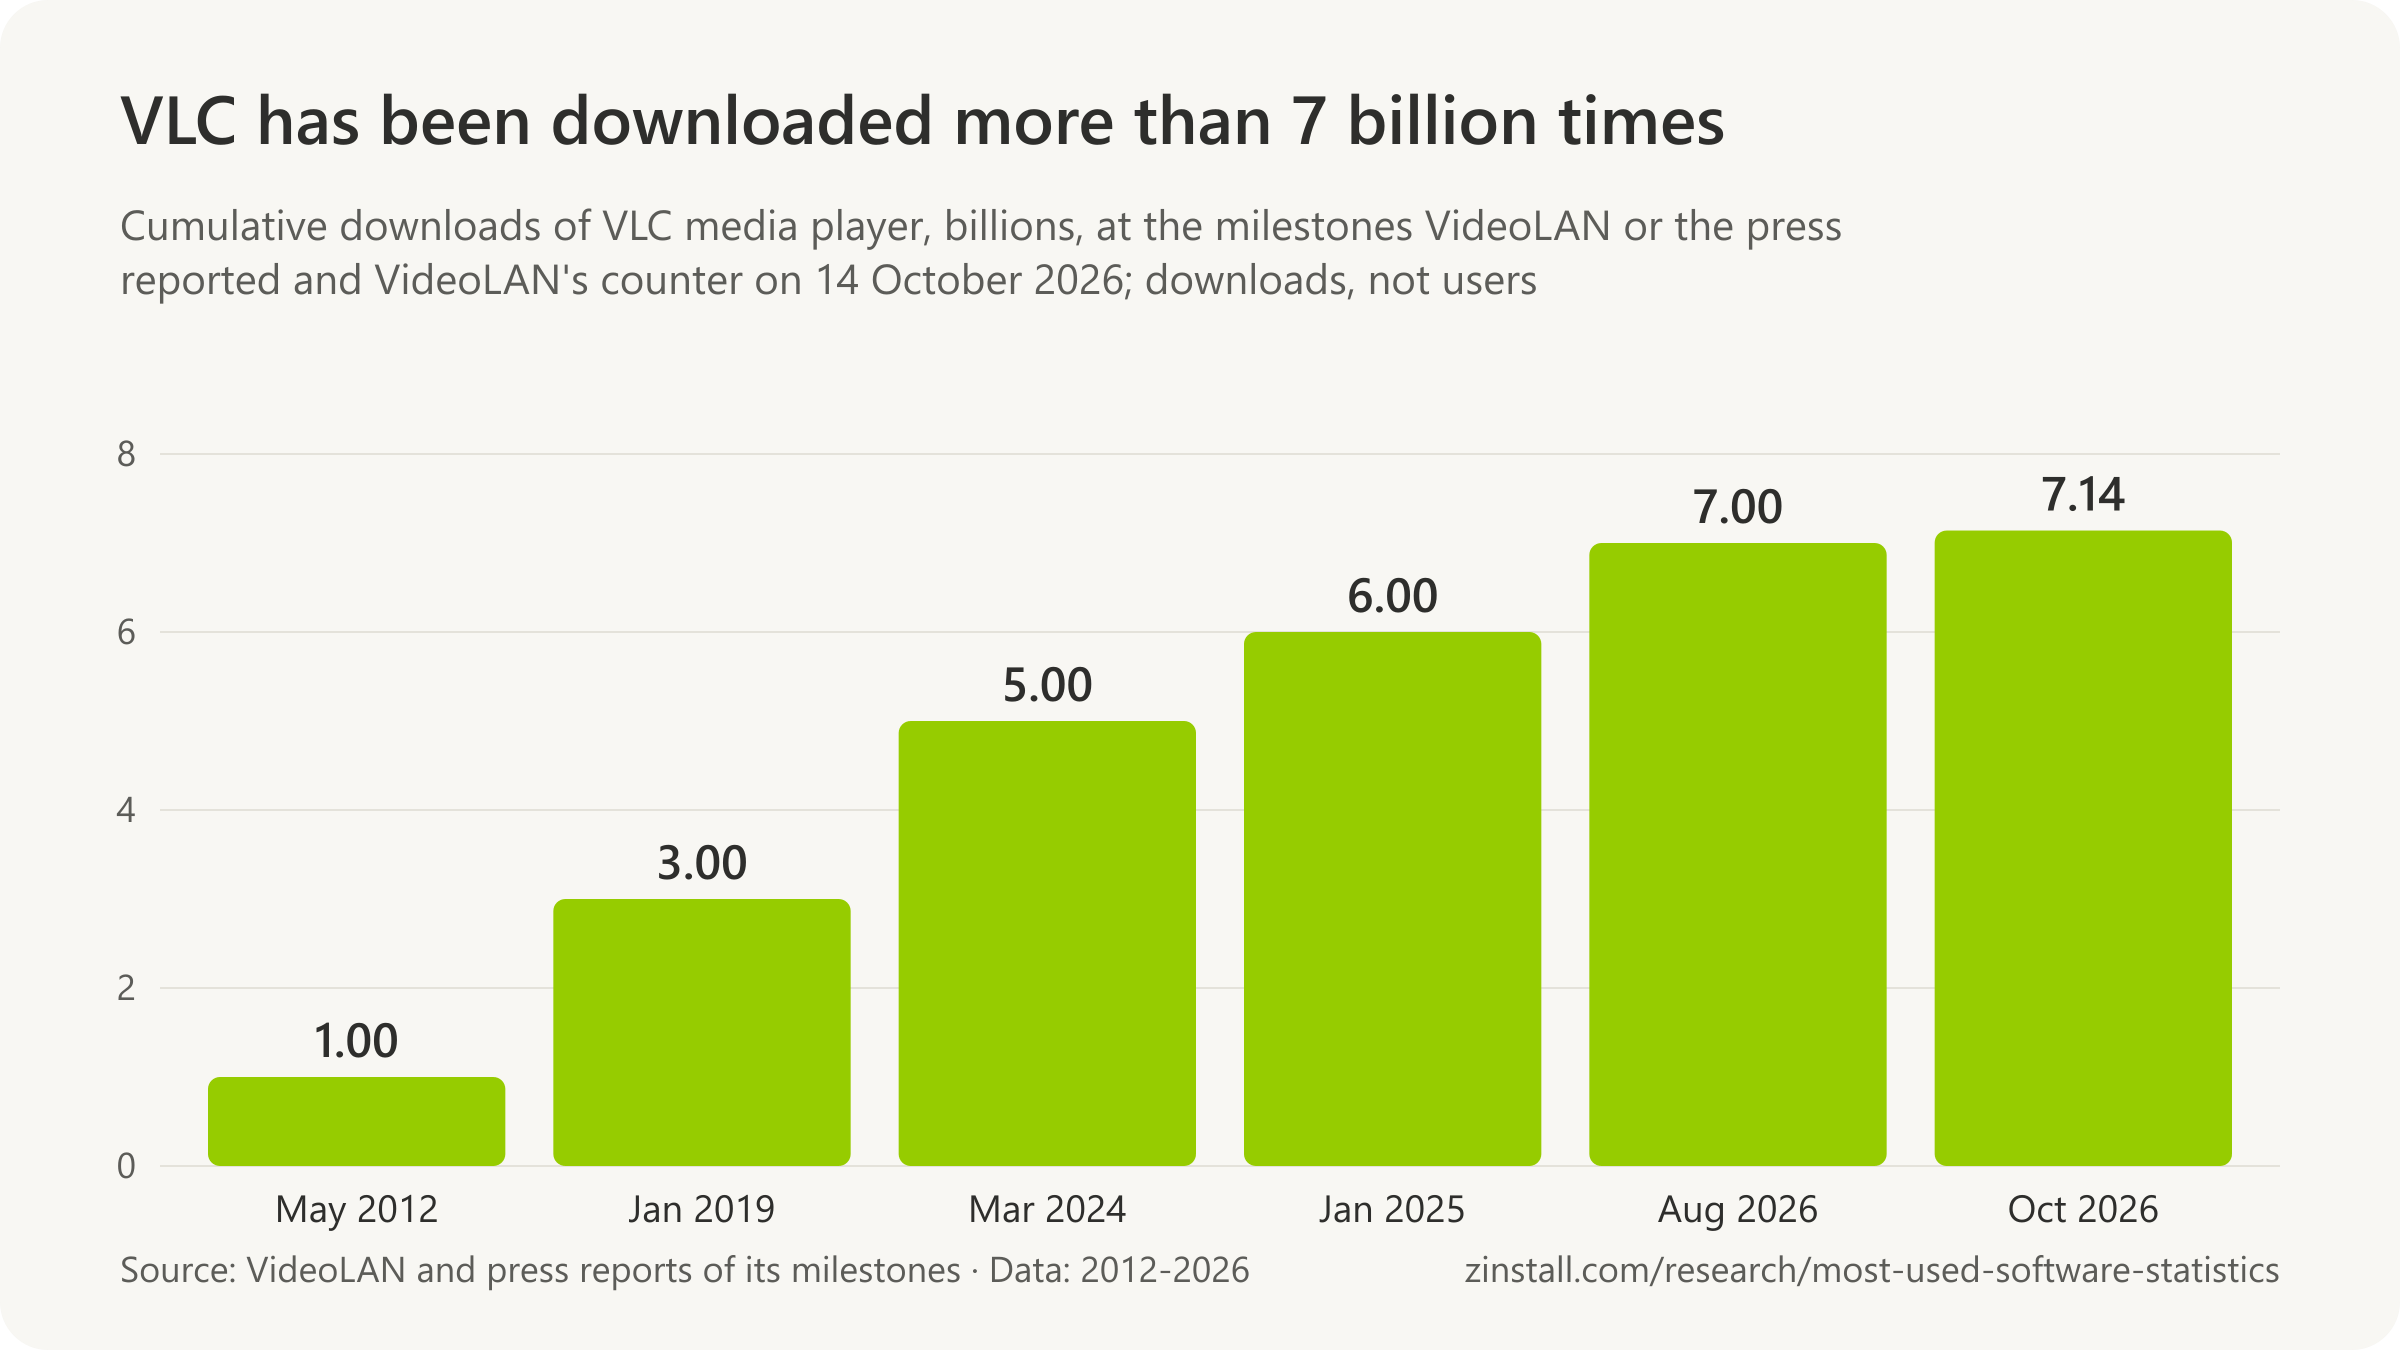
- 5.6 billion downloads of VLC media player for Windows had been made from VideoLAN's servers since February 2005, by VideoLAN's own counter on 14 October 2026 (VideoLAN, 2026).
- 413 million downloads of VLC media player for Mac had been made from VideoLAN's servers since February 2005, by VideoLAN's own counter on 14 October 2026 (VideoLAN, 2026).
- 7.1 billion downloads of VLC media player on all platforms had been counted since 2005, by VideoLAN's own counter on 14 October 2026, of which 6.0 billion were desktop downloads from its servers and 1.1 billion were counted for its Android and iOS apps (VideoLAN, 2026).
- 80.7 million downloads of VLC 3.0.24 for Windows and Mac were counted in the 22 days after its release on 22 September 2026, by VideoLAN's counter on 14 October 2026 (VideoLAN, 2026).
- 1 billion downloads of VLC media player from VideoLAN's servers since 2005 were reached in May 2012, VideoLAN announced (VideoLAN, 2012).
- 3 billion downloads of VLC media player from VideoLAN's website were reached in January 2019, VideoLAN announced, adding that the number under-estimates VLC's real downloads (VideoLAN, 2019).
- 6 billion downloads of VLC media player worldwide were passed in January 2025, VideoLAN said at CES, while its president said VLC's active users were still growing (TechCrunch, 2025).
- 7 billion downloads of VLC media player across all platforms were passed by August 2026, about 18 months after the 6 billion mark, VideoLAN's president told TechCrunch (TechCrunch, 2026).
- 300 to 400 million people actively use VLC, VideoLAN's president Jean-Baptiste Kempf estimated in February 2024, the only active-user figure the project has given (NETINT, 2024).
- 5 billion downloads of VLC media player across desktop and mobile were passed in early March 2024, VideoLAN's president told Lowpass (Lowpass, 2024).
- 76.6 million downloads of VLC 3.0.24 'so far' showed on the live counter of VideoLAN's VLC download page at 12:12 UTC on 14 October 2026, three weeks after that version's release (VideoLAN, 2026).
Spotify, Apple Music and iTunes

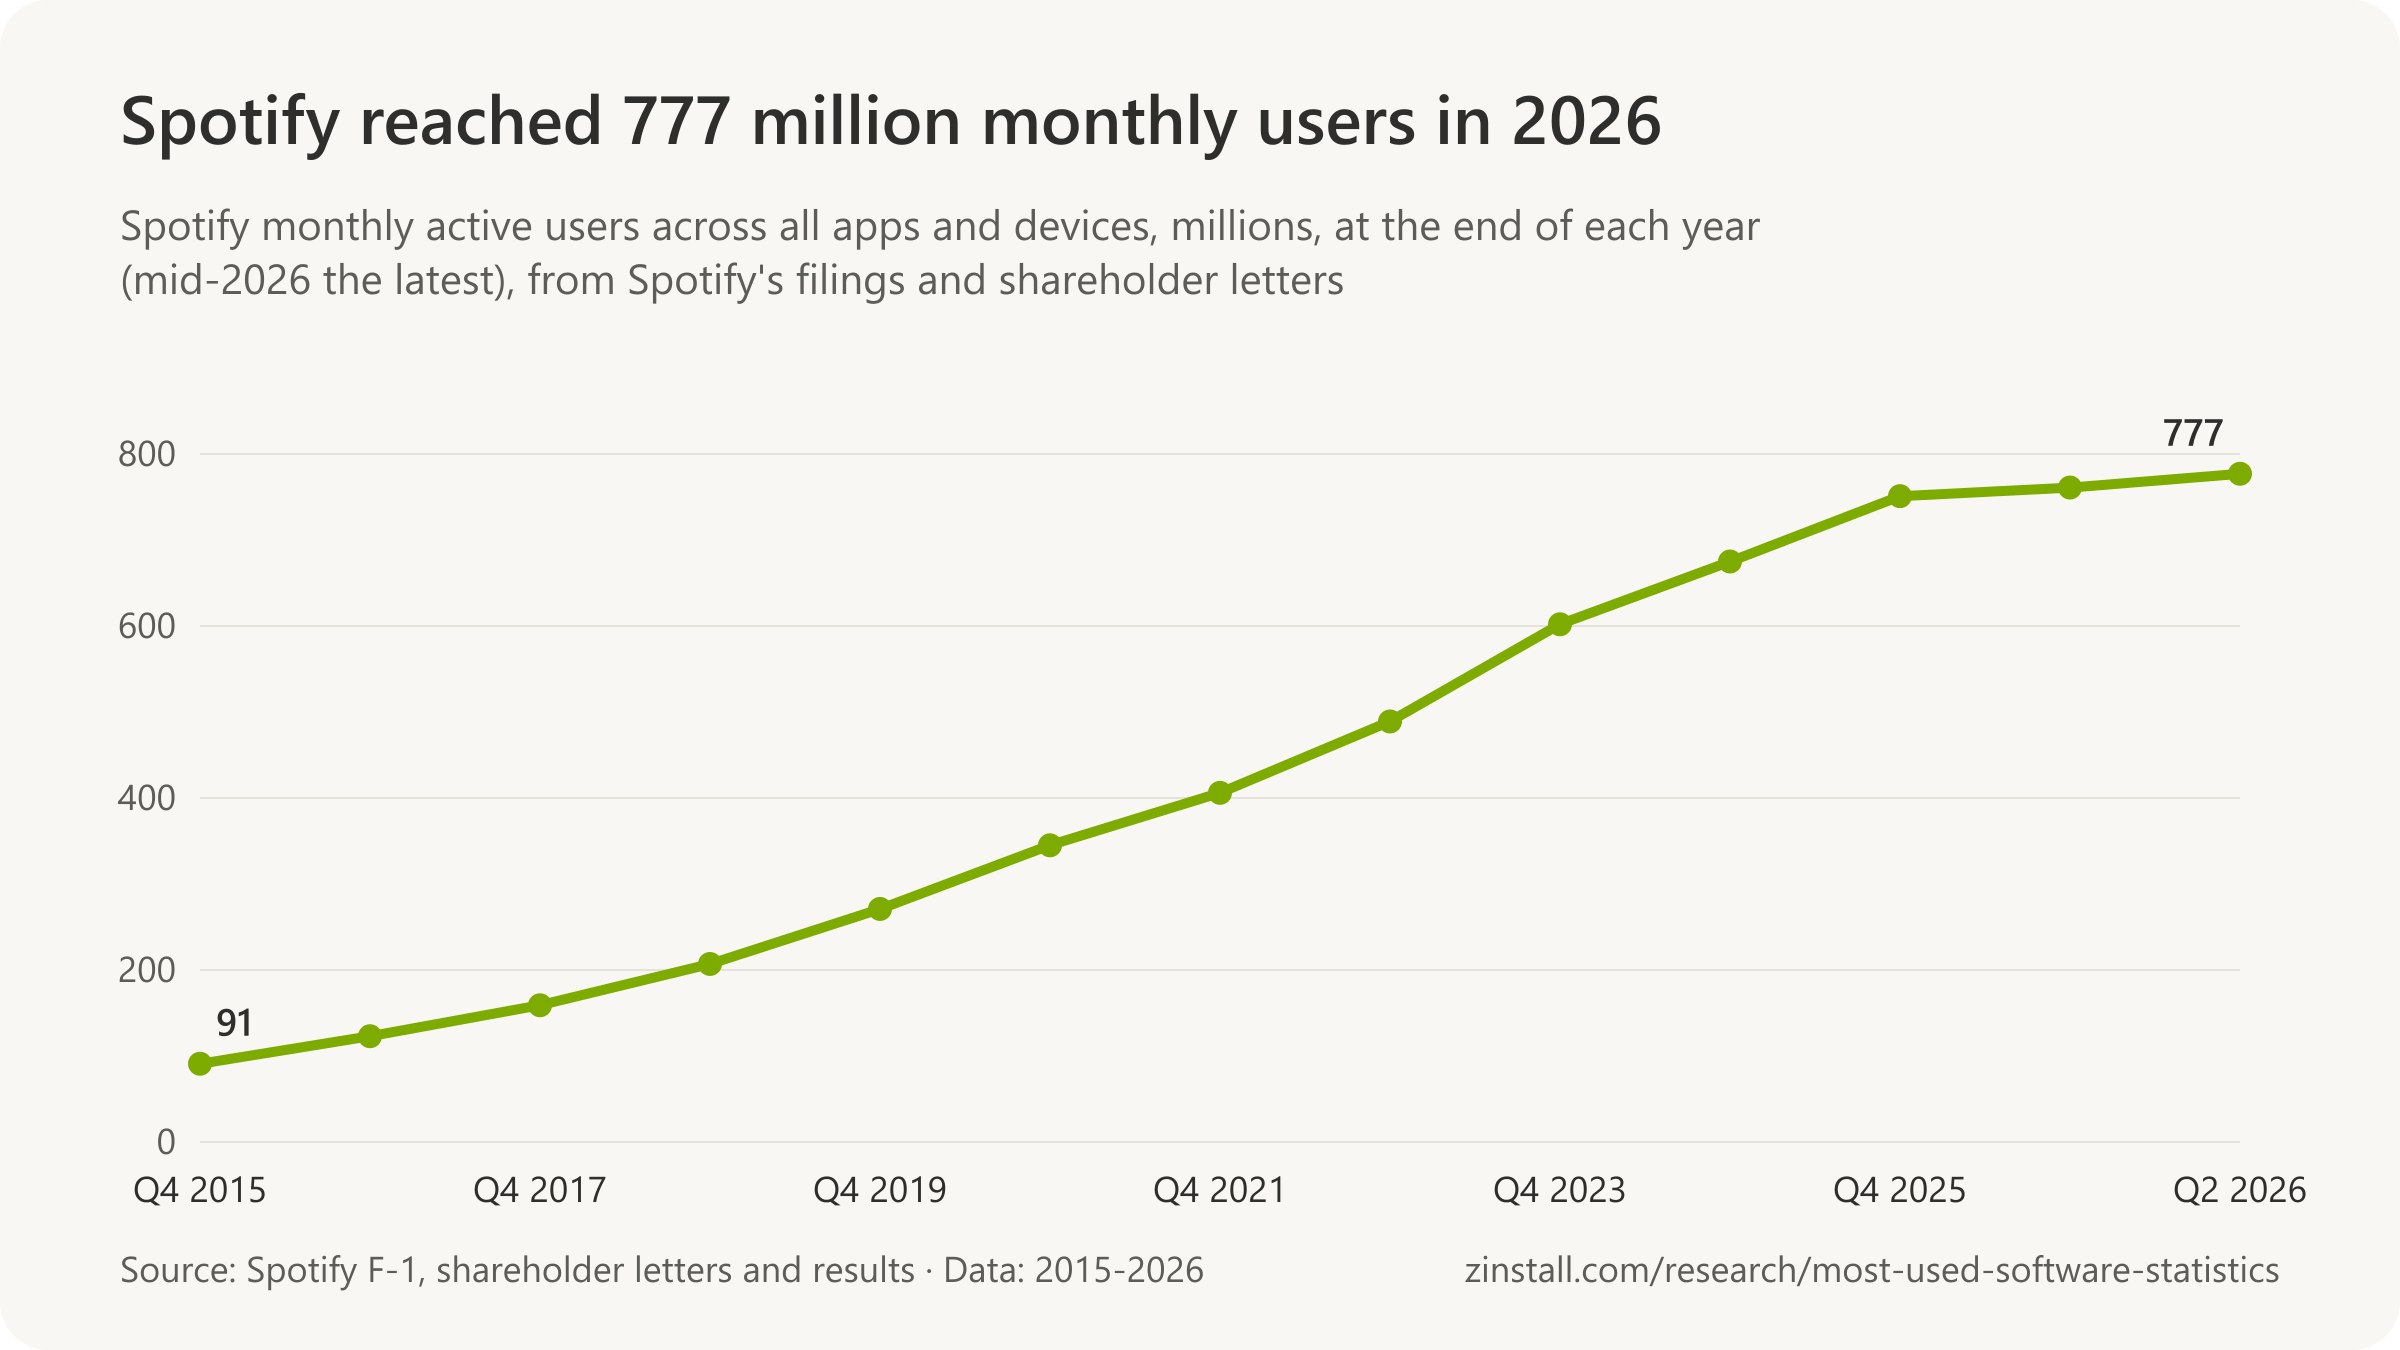
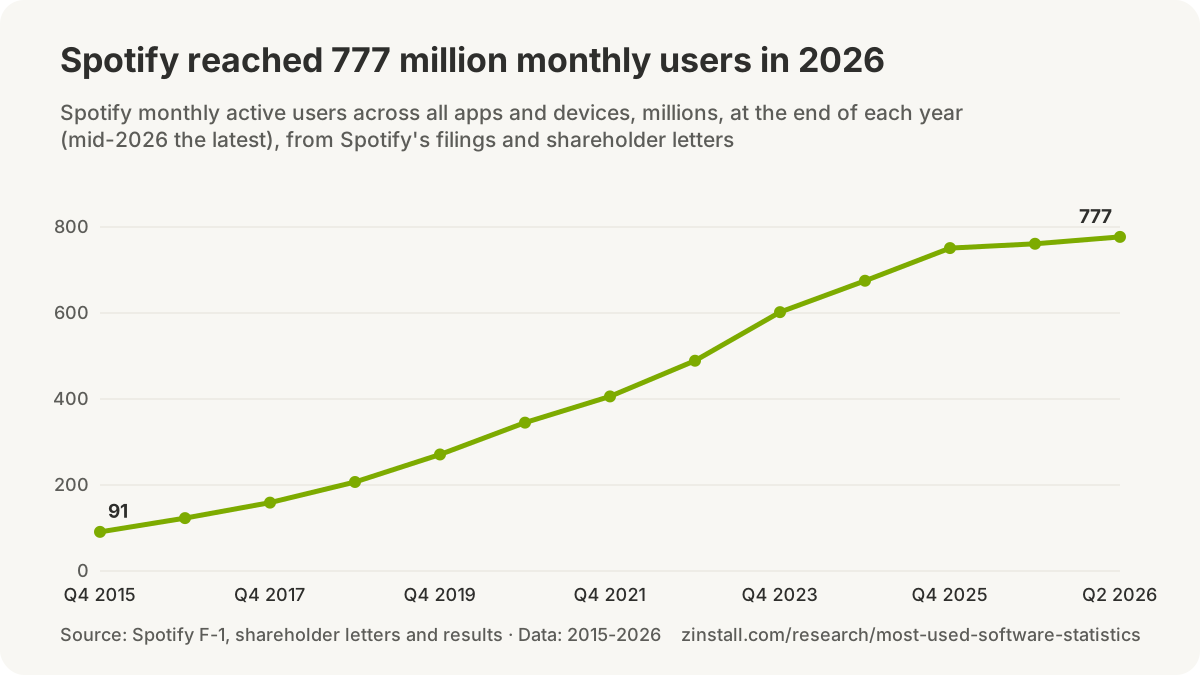
| Quarter | Premium subscribers |
|---|---|
| Q4 2015 | 28 million |
| Q4 2016 | 48 million |
| Q4 2017 | 71 million |
| Q4 2018 | 96 million |
| Q4 2019 | 124 million |
| Q4 2020 | 155 million |
| Q4 2021 | 180 million |
| Q4 2022 | 205 million |
| Q4 2023 | 236 million |
| Q4 2024 | 263 million |
| Q4 2025 | 290 million |
| Q2 2026 | 300 million |
- Spotify counts as a monthly active user any free or Premium account that played content for more than zero milliseconds in the 30 days before the period end, on any of its apps and devices, desktops included, by the definition in its 2025 annual report (Spotify, 2026).
- Most of Spotify's ad-supported listening hours were on mobile devices by 2017, Spotify said in its F-1 registration statement, the only device split it gave in a filing (Spotify, 2018).
- 45% of Spotify listening ran on its desktop app in early 2015, against 42% on phones, 10% on tablets and 3% in the web player, by figures Spotify showed advertisers at CES, TechCrunch reported (TechCrunch, 2015).

- Over 10 million paying subscribers had signed up to Apple Music by January 2016, less than four months after it began charging, Tim Cook said on Apple's earnings call (Apple, 2016).
- 20 million paying subscribers had signed up to Apple Music by December 2016, 18 months after launch, Apple told Billboard (Billboard, 2016).
- 27 million subscribers were using Apple Music in June 2017, Apple said at its WWDC keynote, as reported by Billboard (Billboard, 2017).
- Well over 30 million paying subscribers had signed up to Apple Music by September 2017, Apple told Billboard (Billboard, 2017).
- Over 40 million paid subscribers had signed up to Apple Music by May 2018, Apple CFO Luca Maestri said on its earnings call (Apple, 2018).
- Over 50 million paid subscribers had signed up to Apple Music by January 2019, Tim Cook said on Apple's earnings call, the last count of paying subscribers Apple has given (Apple, 2019).
- More than 60 million subscribers, free-trial users included, had signed up to Apple Music by June 2019, Apple's Eddy Cue told Numerama: the last Apple Music count Apple has given (Numerama, 2019).
- Apple's June 2019 figure of 60 million Apple Music subscribers included people on free trials, an Apple representative told Variety, so it is not a count of paying subscribers (Variety, 2019).
- Apple Music had its best year in 2025, with records in listening and new subscribers, Apple said in January 2026 without giving a subscriber count; the last count it gave was in June 2019 (Apple, 2026).
- More than 225 million iTunes accounts existed in July 2011, Apple CFO Peter Oppenheimer said on its earnings call (Apple, 2011).
- Over 500 million active App Store accounts, the same Apple IDs used for the iTunes Store, existed in January 2013, Apple said in a press release (Apple, 2013).
- Almost 800 million iTunes accounts existed in April 2014, most with credit cards attached, Tim Cook said on Apple's earnings call, the last iTunes account count found (Apple, 2014).
- Over 80% of iTunes users were not Apple Music subscribers in early 2026, Bloomberg reported; Apple gives no count of iTunes users (Bloomberg, 2026).
- Apple announced on 3 June 2019 that macOS Catalina would replace iTunes on the Mac with three apps: Apple Music, Apple Podcasts and Apple TV (Apple, 2019).
- iTunes was replaced on the Mac by the Apple Music, Apple Podcasts and Apple TV apps when macOS Catalina was released on 7 October 2019 (Apple, 2019).
- Apple replaced iTunes for Windows with the Apple Music, Apple TV and Apple Devices apps for Windows 10 and later on 7 February 2024, leaving iTunes for podcasts and audiobooks (Apple, 2024).
- iTunes for Windows was still offered in the Microsoft Store in August 2026 for podcasts and audiobooks, with the Apple Music, Apple TV and Apple Devices apps for everything else, Apple's support page says (Apple, 2026).
Picasa
- Google announced on 12 February 2016 that it would retire Picasa to focus on Google Photos (Google, 2016).
- Google stopped supporting the Picasa desktop application on 15 March 2016; copies already installed kept working but got no further updates (Google, 2016).
- Google began retiring Picasa Web Albums on 1 May 2016, moving albums to Google Photos and to a view-only album archive (Google, 2016).
- The Picasa desktop application stopped working online on 26 March 2018 (no uploads, downloads or online albums), Google said in an update to its retirement post (Google, 2018).
- Google never published a count of Picasa users: its own posts spoke only of millions, such as the millions of Picasa fans who tested the Picasa 3 beta in 2008 (Google, 2008).
- 39.9 million people worldwide visited Picasa online in February 2009, by comScore's count reported by TechCrunch, the last Picasa audience figure found (TechCrunch, 2009).
Numbers in circulation
- VentureBeat reported in March 2017 that Adobe had '4.252 million' paying Creative Cloud users as of March 2016, a figure that matches no Adobe disclosure: Adobe's last count was 6.2 million subscriptions in November 2015 (VentureBeat, 2017).
- 41 million paid Creative Cloud subscribers at the end of 2025 is an estimate by the ProDesignTools blog, computed from Adobe's revenue growth on top of an analysts' figure of 12 million for 2017, not a number Adobe has published (ProDesignTools, 2025).
- An estimated 41 million people pay for Creative Cloud, the Skillademia statistics page said in 2026, citing ProDesignTools' estimate of subscriptions as a count of people (Skillademia, 2026).
- Photoshop had around 32.5 million users in 2025, the Design Your Way statistics page said, a number that tracks third-party estimates of Creative Cloud subscriptions rather than any Adobe count of Photoshop users (Design Your Way, 2025).
- Adobe Photoshop has over 29 million Creative Cloud subscribers as of late 2023, the ZipDo statistics page said in 2026, citing only adobe.com and other site homepages (ZipDo, 2026).
- Creative Cloud has 24 million paying members, the Amra and Elma Photoshop statistics page said in 2026, repeating an older blog estimate as current (Amra and Elma, 2026).
- Roughly 4 million people use Figma, TechCrunch wrote in June 2022 without giving a source, a number still repeated after Figma itself reported more than 13 million monthly active users in 2025 (TechCrunch, 2022).
- Over 60 million paid subscribers is Apple's last confirmed Apple Music count, SQ Magazine says, but Apple said that June 2019 figure included free trials; its last paid-only count was over 50 million in January 2019 (SQ Magazine, 2026).
- Apple Music has over 94 million subscribers, demandsage says, citing Statista; Apple has published no subscriber count since June 2019, so the figure is a third-party estimate (demandsage, 2025).
- Apple has nearly 800 million registered iTunes users, each with a credit card, and is on track for 1 billion users, Hypebot wrote in 2014, turning Apple's count of accounts into users (Hypebot, 2014).
- Picasa Web Albums peaked at over 100 million monthly unique visitors in 2011 and the desktop app passed 18 million downloads by 2009, an ExpertBeacon article claims; neither citation could be traced (ExpertBeacon, 2024).
- 52% of Spotify users streamed on phones and tablets, Silicon Republic's 2015 headline said, but the figures Spotify showed advertisers were shares of streams, with 45% on the desktop app (Silicon Republic, 2015).
- Spotify has 777 million monthly active users, demandsage says, matching Spotify's second-quarter 2026 figure; it gives no desktop split because Spotify publishes none (demandsage, 2026).
- Over 4.4 million active subscriptions to AutoCAD and AutoCAD LT as of 2022, a sales-leads site says Autodesk reports, though Autodesk has never published an AutoCAD-only subscription count (ReadyContacts, 2026).
- Almost 12 million people worldwide might be using AutoCAD and AutoCAD LT for free, an Oman Observer opinion column said Autodesk believed in March 2017 (Oman Observer, 2017).
- CorelDRAW has a community of over 10 million users, an Indian software marketplace says without a source (Techjockey, 2026).
- Corel's products are used by more than 100 million people in over 75 countries, a 2026 company profile says Corel states, repeating a figure from Corel's 2008 annual report (Yespress, 2026).
- SolidWorks had an estimated 7.5 million users as of 2024, Wikipedia says, citing an Engineering.com guide that gives 8 million active users shared by Dassault in February 2023 (Wikipedia, 2026).
- SOLIDWORKS has an estimated 7.5 million users across more than 80 countries as of 2024, a careers site repeats from Wikipedia (Apollo Technical, 2026).
Sources: Adobe (2001-2026); Shotkit; TechCrunch (2009-2026); Canva (2021-2025); Figma (2025, 2026); GIMP project (2025, 2026); Flathub; Autodesk; Autodesk, Inc. (2007-2026); InfoWorld; Jon Peddie Research; Engineering.com; Dassault Systèmes (2013-2026); Dassault Systèmes SOLIDWORKS (2016, 2020); Alludo; KKR and Corel Corporation; Corel Corporation (2009, 2026); Architosh; VideoLAN (2012, 2019, 2026); NETINT; Lowpass; Spotify Technology S.A. (2018-2026); Apple Inc. (2011-2026); Billboard (2016, 2017); Numerama; Variety; Bloomberg; Google (2008, 2016); VentureBeat; ProDesignTools; Skillademia; Design Your Way; ZipDo; Amra and Elma; SQ Magazine; DemandSage (2025, 2026); Hypebot; ExpertBeacon; Silicon Republic; ReadyContacts; Oman Observer; Techjockey; Yespress; Wikipedia; Apollo Technical
How many people use ChatGPT, Gemini and Copilot?
ChatGPT had more than 1.2 billion weekly users in October 2026, the highest count published so far (OpenAI, 2026).

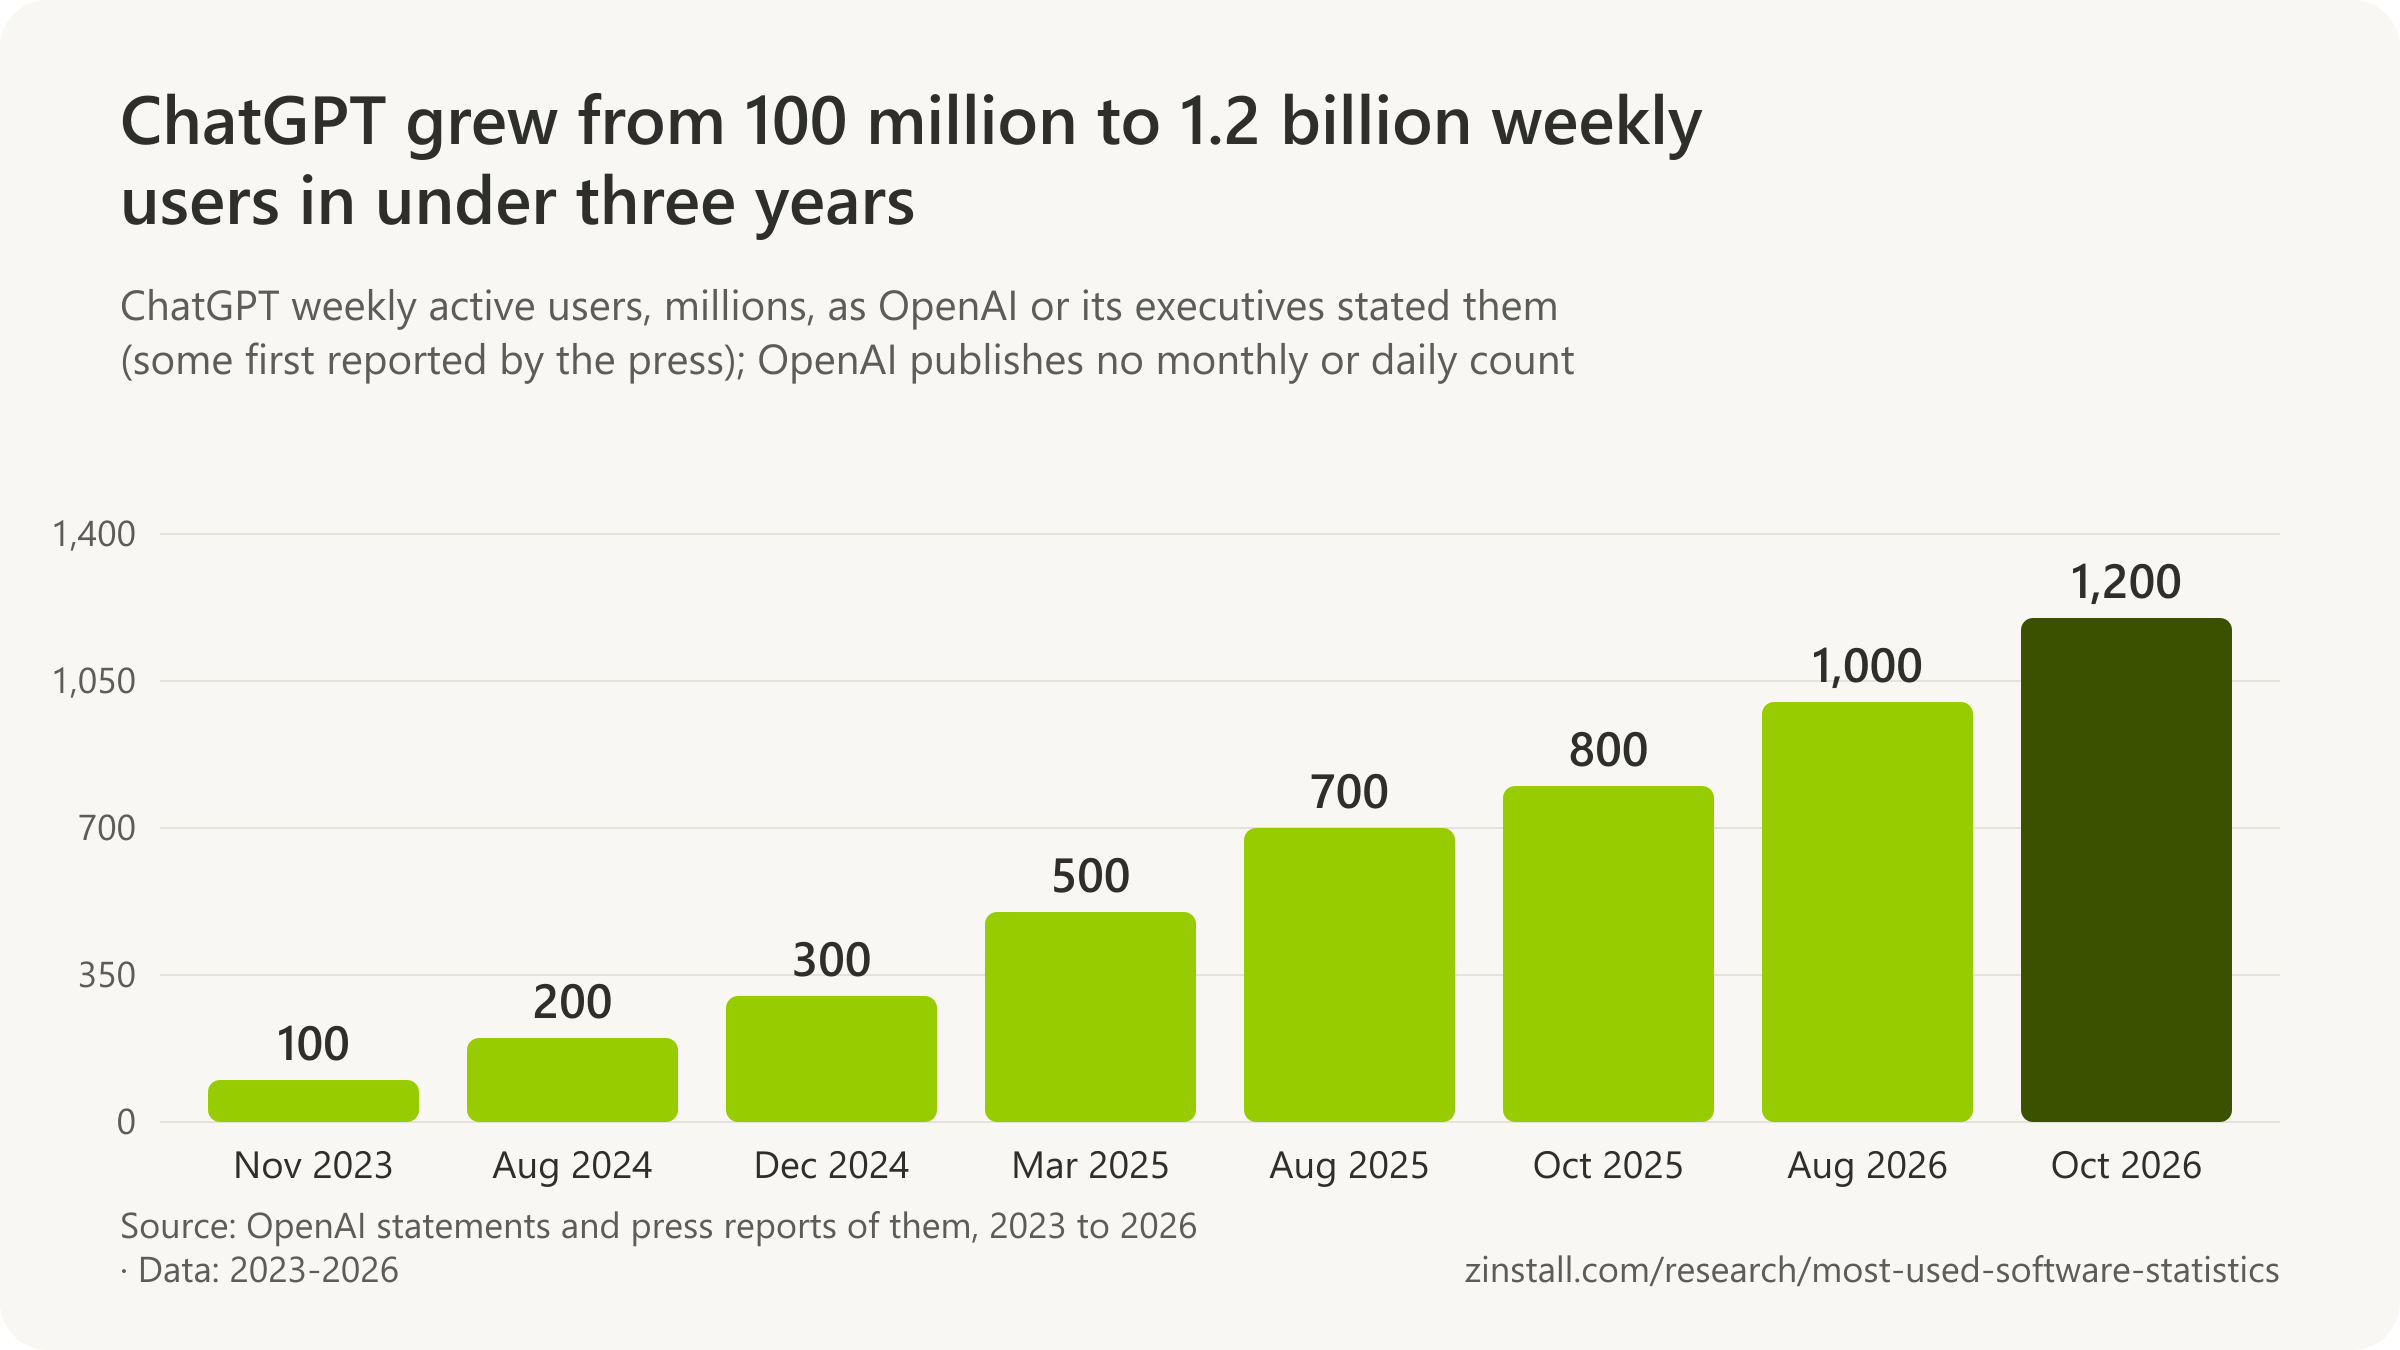
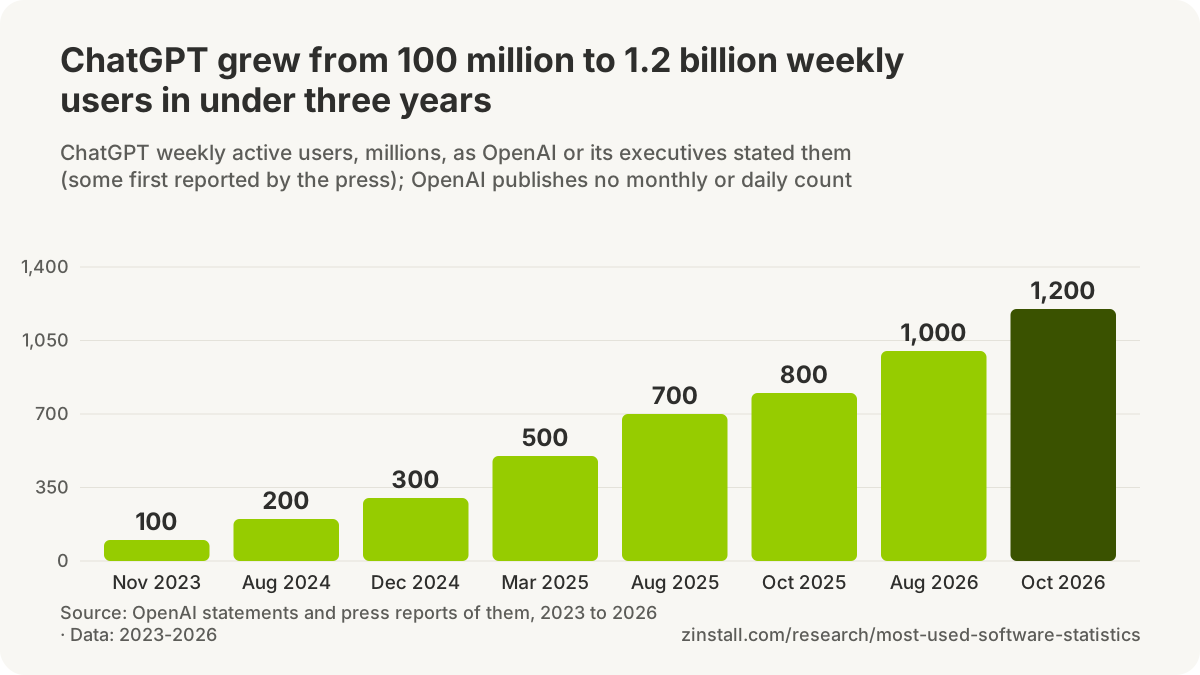
- Google's Gemini app passed 1 billion monthly users in August 2026.
- Meta AI had more than 1 billion monthly users across Meta's apps in October 2025, its last count.
- Microsoft's Copilot apps had more than 150 million monthly users in September 2025.
- Microsoft 365 Copilot passed 30 million paid seats in June 2026.
- 44% of US adults said they had ever used ChatGPT, in February 2026.
| Chatbot | Share of referrals |
|---|---|
| ChatGPT | 80.5% |
| Gemini | 10.9% |
| Perplexity | 5.9% |
| Microsoft Copilot | 1.8% |
| Claude | 1.0% |
| DeepSeek | less than 0.1% |
Sources: OpenAI (2026a, 2026b, 2025a, 2025b); Google; Meta; Microsoft (2026, 2025); Pew Research Center; StatCounter; TechCrunch; Axios; The Verge; CNBC
More statistics (187)
Each AI company counts in its own measure: OpenAI gives weekly users, Google and Meta give monthly users, Microsoft gives paid seats and monthly users across its Copilot apps, and Anthropic gives business customers. App-analytics firms estimate the rest, and surveys ask people directly.
ChatGPT
- More than 100 million people in 185 countries used ChatGPT every week in April 2024, OpenAI said when it let people start using ChatGPT without an account (OpenAI, 2024).
- Over 250 million people used ChatGPT every week in October 2024, OpenAI said when it announced $6.6 billion of new funding (OpenAI, 2024).
- 500 million people used ChatGPT every week at the end of March 2025, OpenAI said when it announced $40 billion of new funding (OpenAI, 2025).
- 700 million weekly active users of ChatGPT were cited by OpenAI in September 2025 when it published its study of how people use ChatGPT (OpenAI, 2025).
- 800 million or more people used ChatGPT every week in October 2025, OpenAI said at its DevDay developer conference on 6 October 2025 (OpenAI, 2025).
- More than 7 million seats of ChatGPT for Work (OpenAI's paid business plans) were in use in November 2025, up 40% in two months, OpenAI said (OpenAI, 2025).
- More than 1 million business customers paid OpenAI for business use in November 2025, through ChatGPT for Work or its developer platform, OpenAI said (OpenAI, 2025).
- More than 900 million weekly active users used ChatGPT in February 2026, OpenAI said when it announced $110 billion of new investment (OpenAI, 2026).
- More than 50 million consumer subscribers paid for ChatGPT in February 2026, OpenAI said, the only subscriber total it has published (OpenAI, 2026).
- More than 9 million paying business users relied on ChatGPT for work in February 2026, OpenAI said (OpenAI, 2026).
- More than 1 billion active users were reached by OpenAI's models across its products in July 2026, OpenAI's chief financial officer Sarah Friar wrote, in a count that is not limited to ChatGPT and names no time window (OpenAI, 2026).
- More than 2 million businesses were reached by OpenAI's models in July 2026, OpenAI said, double the 1 million business customers it announced in November 2025 (OpenAI, 2026).
- More than 1 billion weekly active users used ChatGPT in August 2026, OpenAI said when its ChatGPT advertising business reached a $1 billion annual revenue run rate (OpenAI, 2026).
- 2.5 million businesses and more than 1 billion weekly active users were reached by OpenAI's products in September 2026, Sarah Friar wrote (OpenAI, 2026).
- 1.2 billion weekly users of ChatGPT were cited by OpenAI at its DevDay developer conference on 29 September 2026 (OpenAI, 2026).
- More than 1.2 billion people used ChatGPT every week in October 2026, OpenAI said when it released GPT-6 to all users, the highest figure it has published (OpenAI, 2026).
- 1 million users had signed up to ChatGPT five days after its 30 November 2022 launch, OpenAI chief executive Sam Altman posted on 5 December 2022 (Sam Altman, 2022).
- 100 million monthly active users was UBS analysts' estimate for ChatGPT in January 2023, two months after launch, based on Similarweb web-traffic data rather than any OpenAI figure (Reuters, 2023).
- 100 million weekly active users used ChatGPT in November 2023, OpenAI chief executive Sam Altman said at the company's first DevDay conference, as reported by TechCrunch (TechCrunch, 2023).
- More than 600,000 people had signed up to use ChatGPT Enterprise by April 2024, up from about 150,000 in January, OpenAI chief operating officer Brad Lightcap told Bloomberg (Bloomberg, 2024).
- More than 200 million weekly active users used ChatGPT in August 2024, twice as many as in November 2023, OpenAI told Axios (Axios, 2024).
- 1 million paying business users of ChatGPT Enterprise, Team and Edu were reported by OpenAI in September 2024, up from 600,000 in April (VentureBeat, 2024).
- Over 300 million people used ChatGPT each week in December 2024, Sam Altman said at The New York Times DealBook Summit, as reported by The Verge (The Verge, 2024).
- 400 million weekly active users used ChatGPT in February 2025, up 33% from 300 million in December, OpenAI chief operating officer Brad Lightcap told CNBC (CNBC, 2025).
- 2 million paying enterprise users of ChatGPT were counted by OpenAI in February 2025, roughly double September 2024, chief operating officer Brad Lightcap told CNBC (CNBC, 2025).
- 3 million paying business users of ChatGPT Enterprise, Team and Edu were announced by OpenAI in June 2025, up from 2 million in February (CNBC, 2025).
- 700 million weekly active users was the level ChatGPT was set to reach in the first week of August 2025, up from 500 million in March and more than four times a year earlier, OpenAI said (CNBC, 2025).
- 5 million paying business users of ChatGPT were counted by OpenAI in August 2025, up from 3 million in June (CNBC, 2025).
- 500 million weekly active users was still the last ChatGPT figure OpenAI had stated when Sam Altman spoke at TED on 11 April 2025, though he added that 'something like 10 percent of the world' used its systems (TED, 2025).
- 100 million weekly active users of ChatGPT were in India in February 2026, its second-largest user base after the United States, Sam Altman wrote in the Times of India, as reported by TechCrunch (TechCrunch, 2026).
- No daily or monthly active user count for ChatGPT has been published by OpenAI: its chief financial officer wrote in January 2026 that both weekly and daily active users were at all-time highs without giving either number (OpenAI, 2026).
- About 10% of the world's adult population (700 million weekly active users) used ChatGPT by July 2025, according to a working paper by OpenAI's economic research team and Harvard economist David Deming (NBER, 2025).
- 1 billion monthly active users of the ChatGPT mobile app were reached in May 2026, about three years after launch and faster than any other app, by Sensor Tower's estimate (Sensor Tower, 2026).
- Over 1 billion visits were made to ChatGPT's website (chat.openai.com) in February 2023, up from 616 million in January and 266 million in December 2022, from 153 million unique visitors, by Similarweb's estimate (Similarweb, 2023).
- 1.8 billion visits to ChatGPT's website in May 2023 were its 2023 peak before a summer slump, by Similarweb's estimate published in May 2024 (Similarweb, 2024).
- 3.1 billion visits were made to chatgpt.com in September 2024, up 112% year on year and making it the 11th most visited website in the world, by Similarweb's estimate (Similarweb, 2024).
- 5.7 billion visits were made to chatgpt.com in July 2025, against 84.5 billion to google.com, about 700 million to Gemini and 141 million to Perplexity, by Similarweb's estimate (Similarweb, 2025).
- 5.6 billion visits were made to chatgpt.com in August 2026, the fifth most visited website in the world and 2.9% fewer than a year earlier, against 2.6 billion to gemini.google.com, by Similarweb's estimate (Similarweb, 2026).
Microsoft Copilot and GitHub Copilot

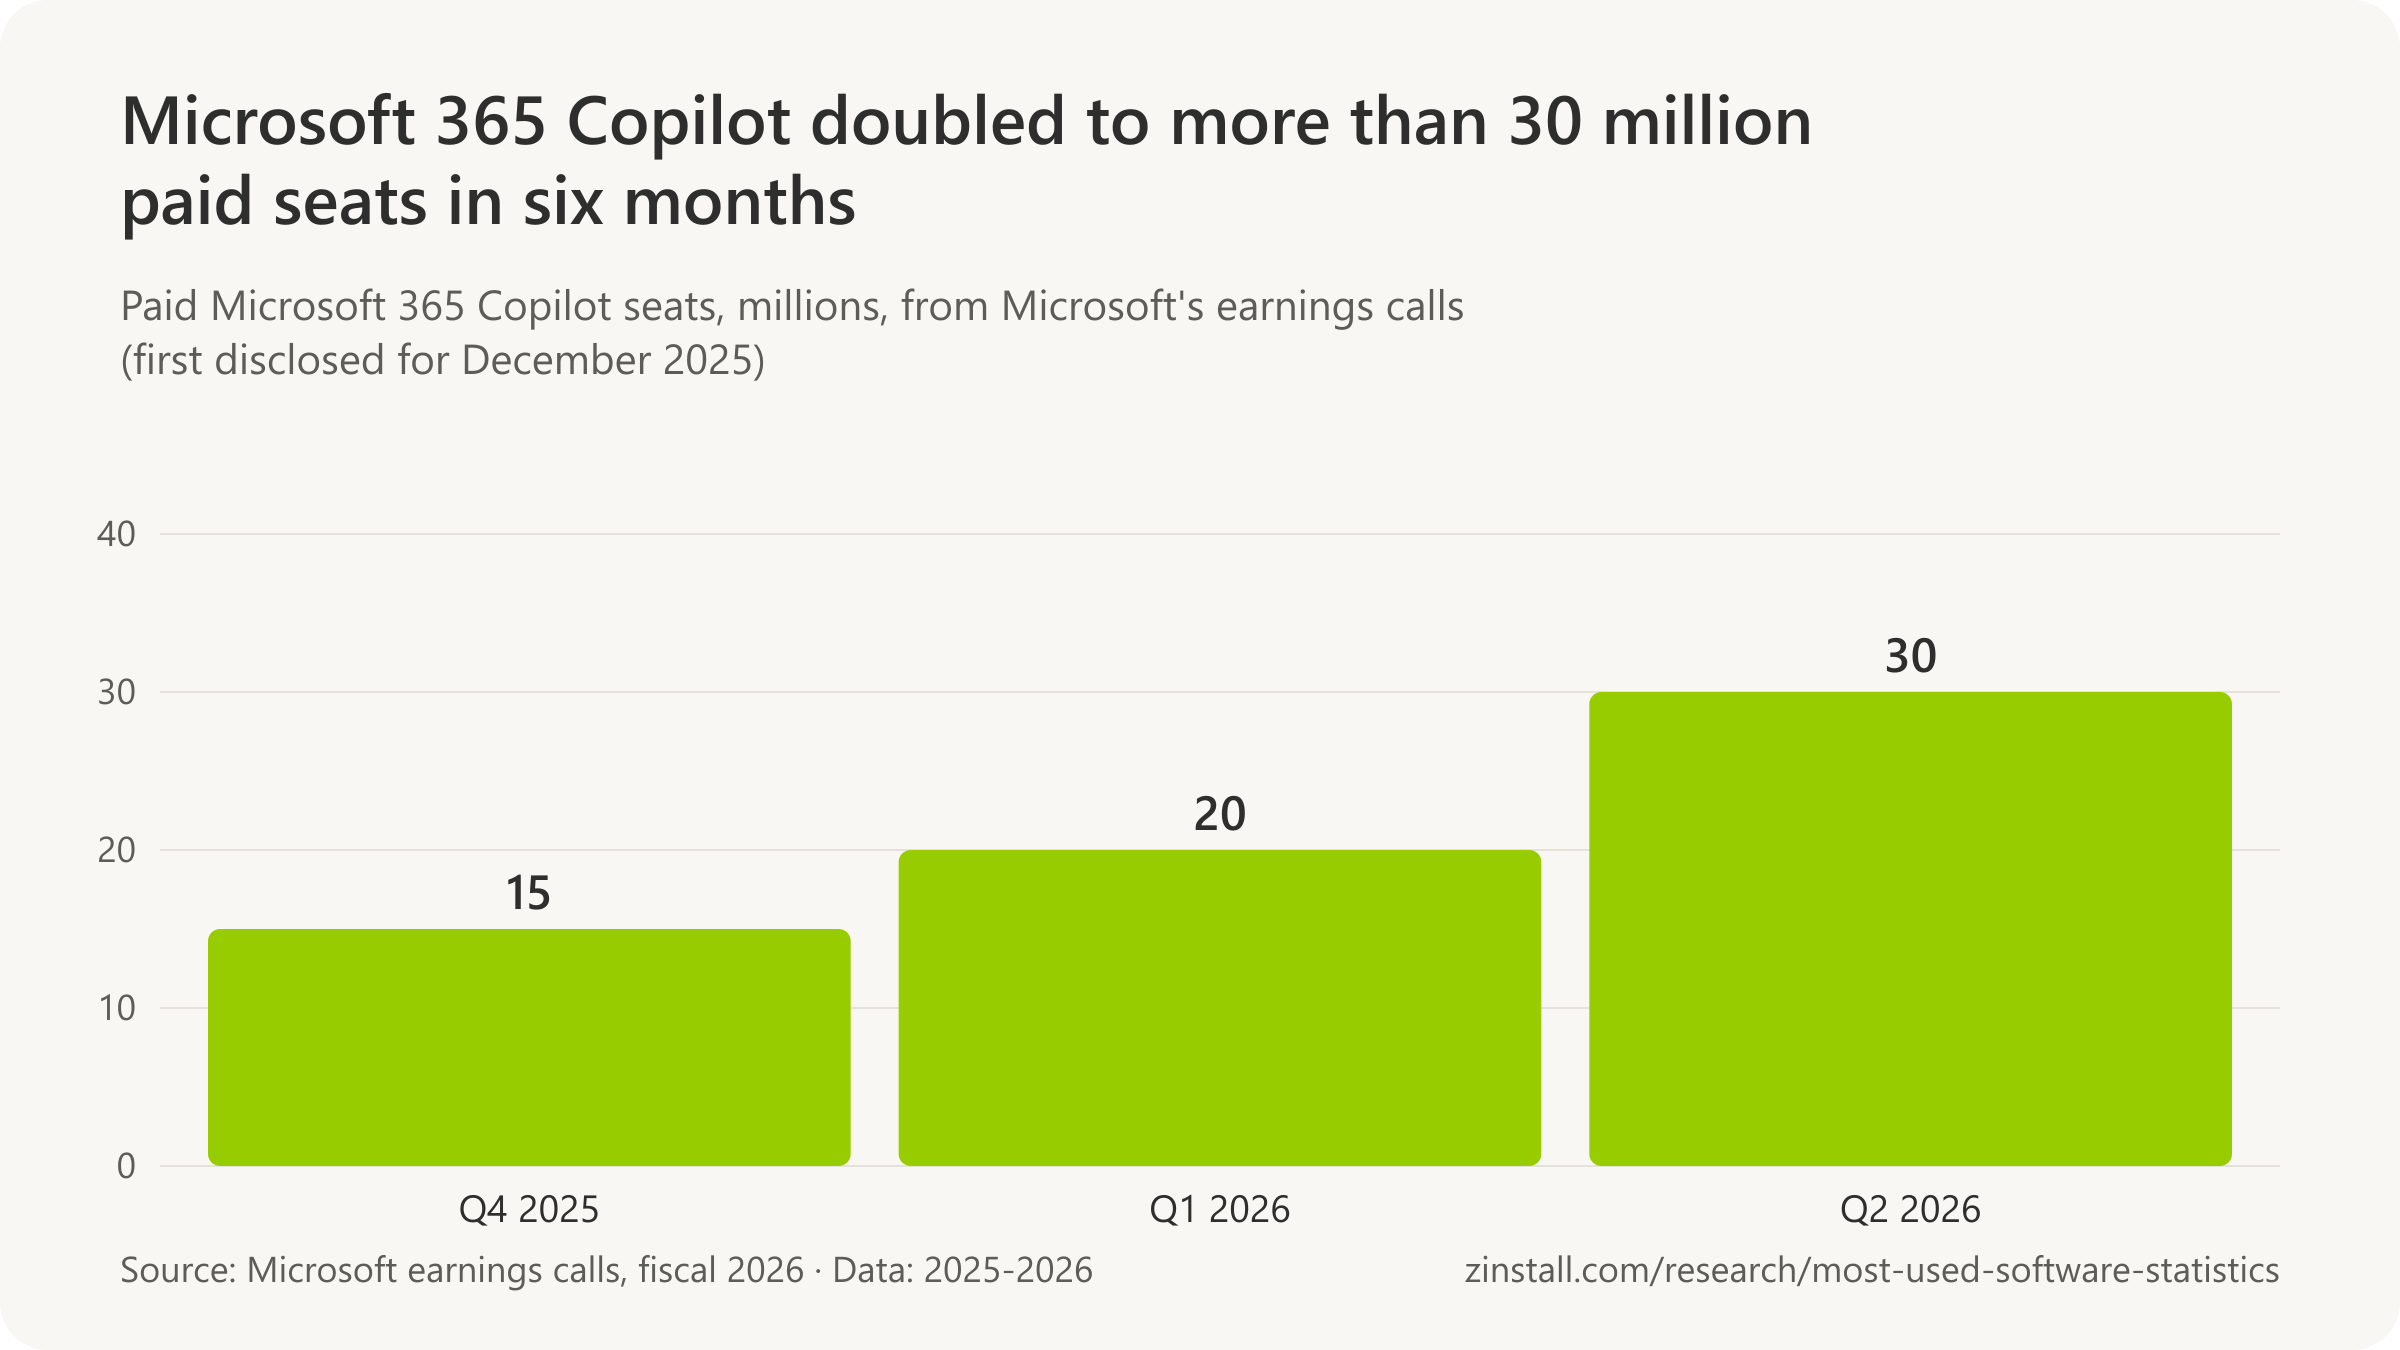
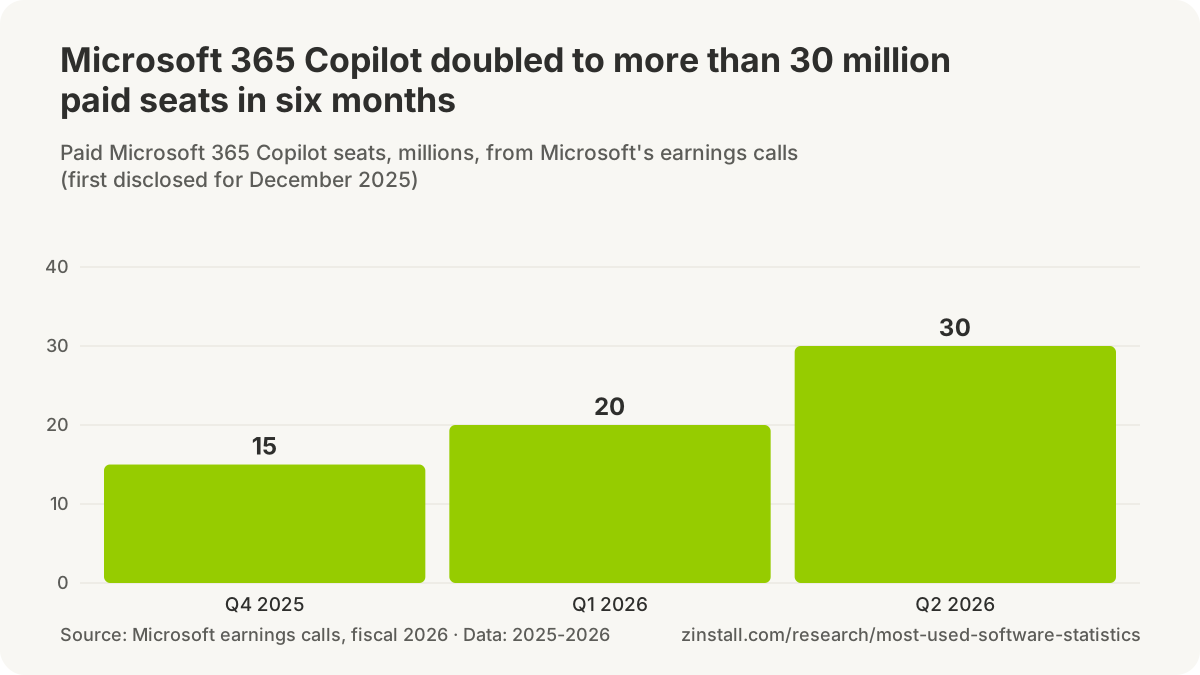

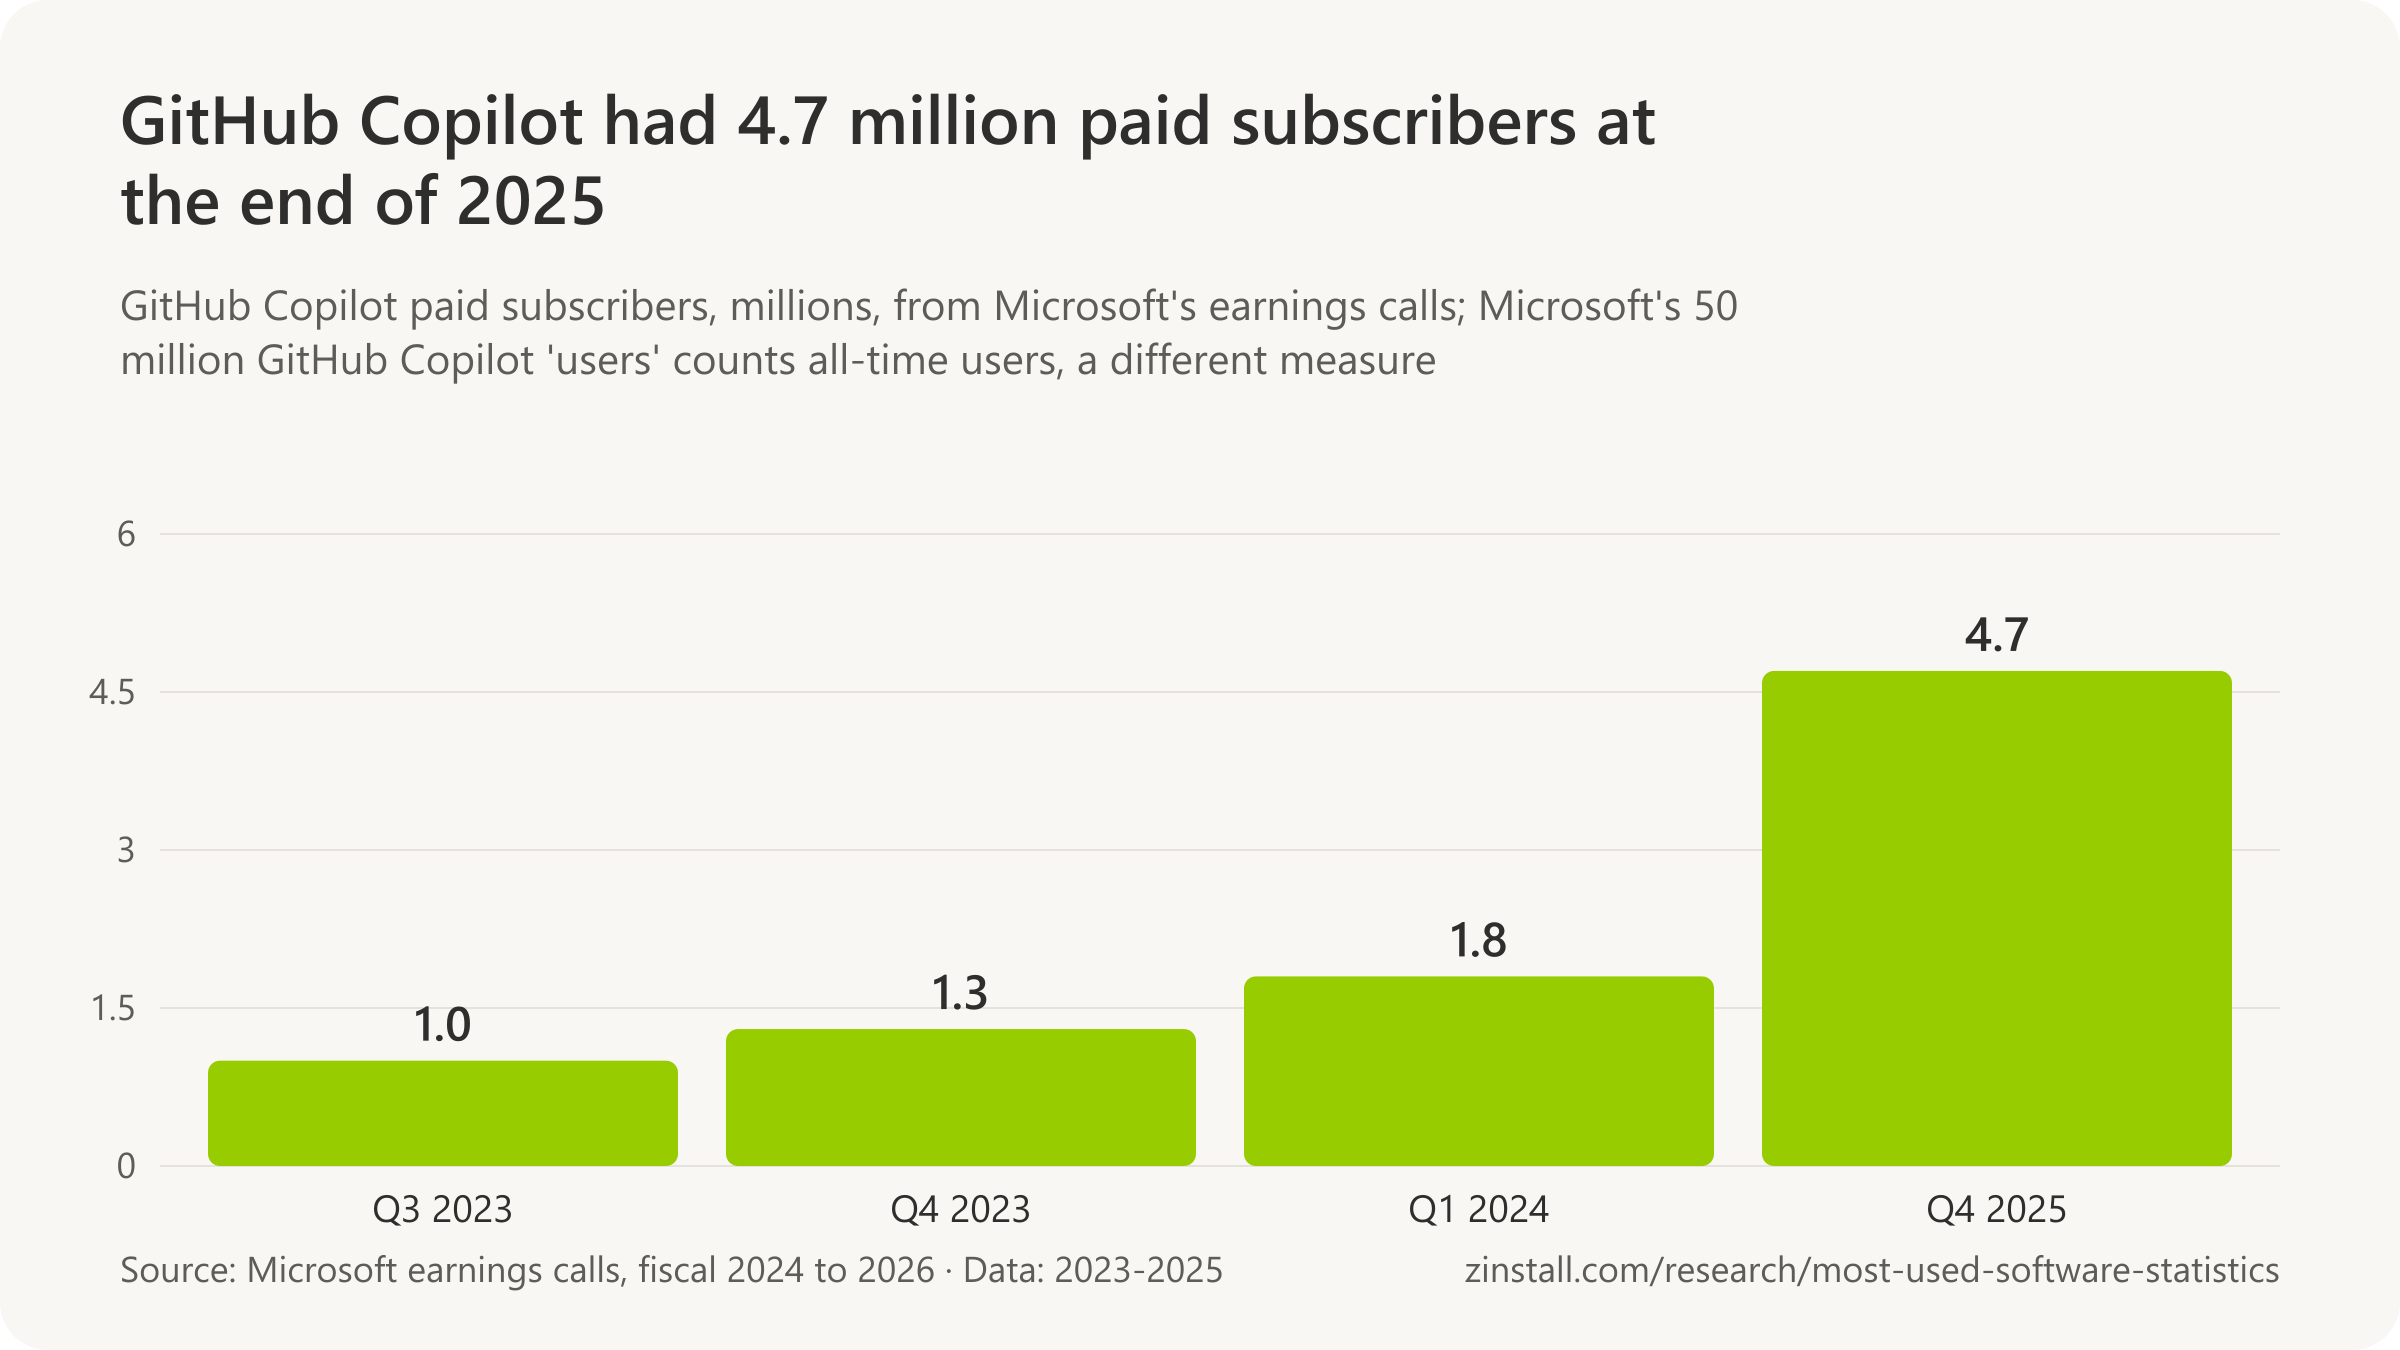
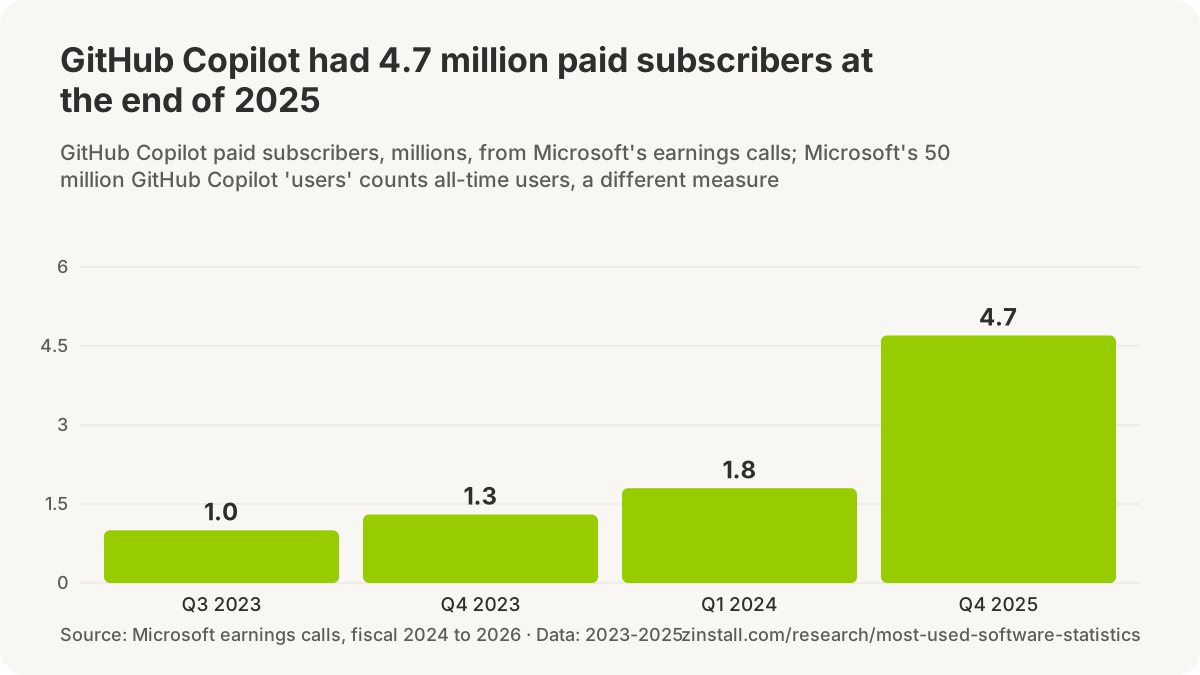
- Over 100 million monthly active users were using Microsoft's family of Copilot apps, commercial and consumer combined, by the end of June 2025, Microsoft said on its July 2025 earnings call (Microsoft, 2025).
- Over 800 million monthly active users engaged with AI features across Microsoft's products by the end of June 2025, a broader measure than its Copilot apps, Microsoft said on its July 2025 earnings call (Microsoft, 2025).
- Over 150 million monthly active users were using Microsoft's first-party family of Copilots across information work, coding, security, science, health and consumer by the end of September 2025, Microsoft said on its October 2025 earnings call (Microsoft, 2025).
- 900 million monthly active users used AI features across Microsoft's products by the end of September 2025, Microsoft said on its October 2025 earnings call (Microsoft, 2025).
- 15 million paid Microsoft 365 Copilot seats were in use at the end of December 2025, Microsoft's first disclosed seat count for its workplace Copilot, Microsoft said on its January 2026 earnings call (Microsoft, 2026).
- Over 20 million paid Microsoft 365 Copilot seats were in use at the end of March 2026, Microsoft said on its April 2026 earnings call (Microsoft, 2026).
- Over 30 million paid Microsoft 365 Copilot seats were in use at the end of June 2026, with net seat additions more than doubling from the previous quarter, Microsoft said on its July 2026 earnings call (Microsoft, 2026).
- Over 1 million paid users were subscribed to GitHub Copilot, Microsoft's AI coding assistant, by the end of September 2023, Microsoft said on its October 2023 earnings call (Microsoft, 2023).
- Over 1.3 million paid subscribers were using GitHub Copilot by the end of December 2023, up 30% in a quarter, Microsoft said on its January 2024 earnings call (Microsoft, 2024).
- 1.8 million paid subscribers were using GitHub Copilot by the end of March 2024, with growth accelerating to over 35% a quarter, Microsoft said on its April 2024 earnings call (Microsoft, 2024).
- Over 4.7 million paid subscribers were using GitHub Copilot by the end of December 2025, up 75% in a year, Microsoft said on its January 2026 earnings call (Microsoft, 2026).
- Over 15 million users had used GitHub Copilot by the end of March 2025, up more than fourfold in a year, Microsoft said on its April 2025 earnings call (Microsoft, 2025).
- 20 million users had used GitHub Copilot by the end of June 2025, an all-time count rather than active users, Microsoft said on its July 2025 earnings call (Microsoft, 2025).
- 20 million is GitHub Copilot's all-time user count, not its active users, a GitHub spokesperson told TechCrunch after Microsoft's July 2025 earnings call, so about 5 million people tried it for the first time in three months (TechCrunch, 2025).
- Over 26 million users had used GitHub Copilot by the end of September 2025, by Microsoft's all-time count, Microsoft said on its October 2025 earnings call (Microsoft, 2025).
- 50 million users had used GitHub Copilot by the end of June 2026, by Microsoft's all-time count, Microsoft said on its July 2026 earnings call (Microsoft, 2026).
- Nearly 3 times as many daily users used Microsoft's consumer Copilot app at the end of 2025 as a year earlier, Microsoft said on its January 2026 earnings call without giving a user count (Microsoft, 2026).
- Nearly 70% of Fortune 500 companies were using Microsoft 365 Copilot by September 2024, Microsoft said on its October 2024 earnings call (Microsoft, 2024).
- About 7% of Microsoft 365's paid commercial seats carried a paid Microsoft 365 Copilot seat by mid-2026, GeekWire calculated from Microsoft's figures of 30 million Copilot seats and more than 450 million commercial seats (GeekWire, 2026).
- 150 million monthly active users across Microsoft's Copilots, commercial and consumer combined, was the total a Microsoft spokesperson gave TechCrunch in January 2026, the same figure as in October 2025 and Microsoft's latest stated count (TechCrunch, 2026).
- 3.3% of Microsoft 365's paid commercial seats had a paid Microsoft 365 Copilot seat at the end of December 2025 (15 million of more than 450 million), derived from Microsoft's January 2026 earnings call (Microsoft, 2026).
Gemini and Google's AI features

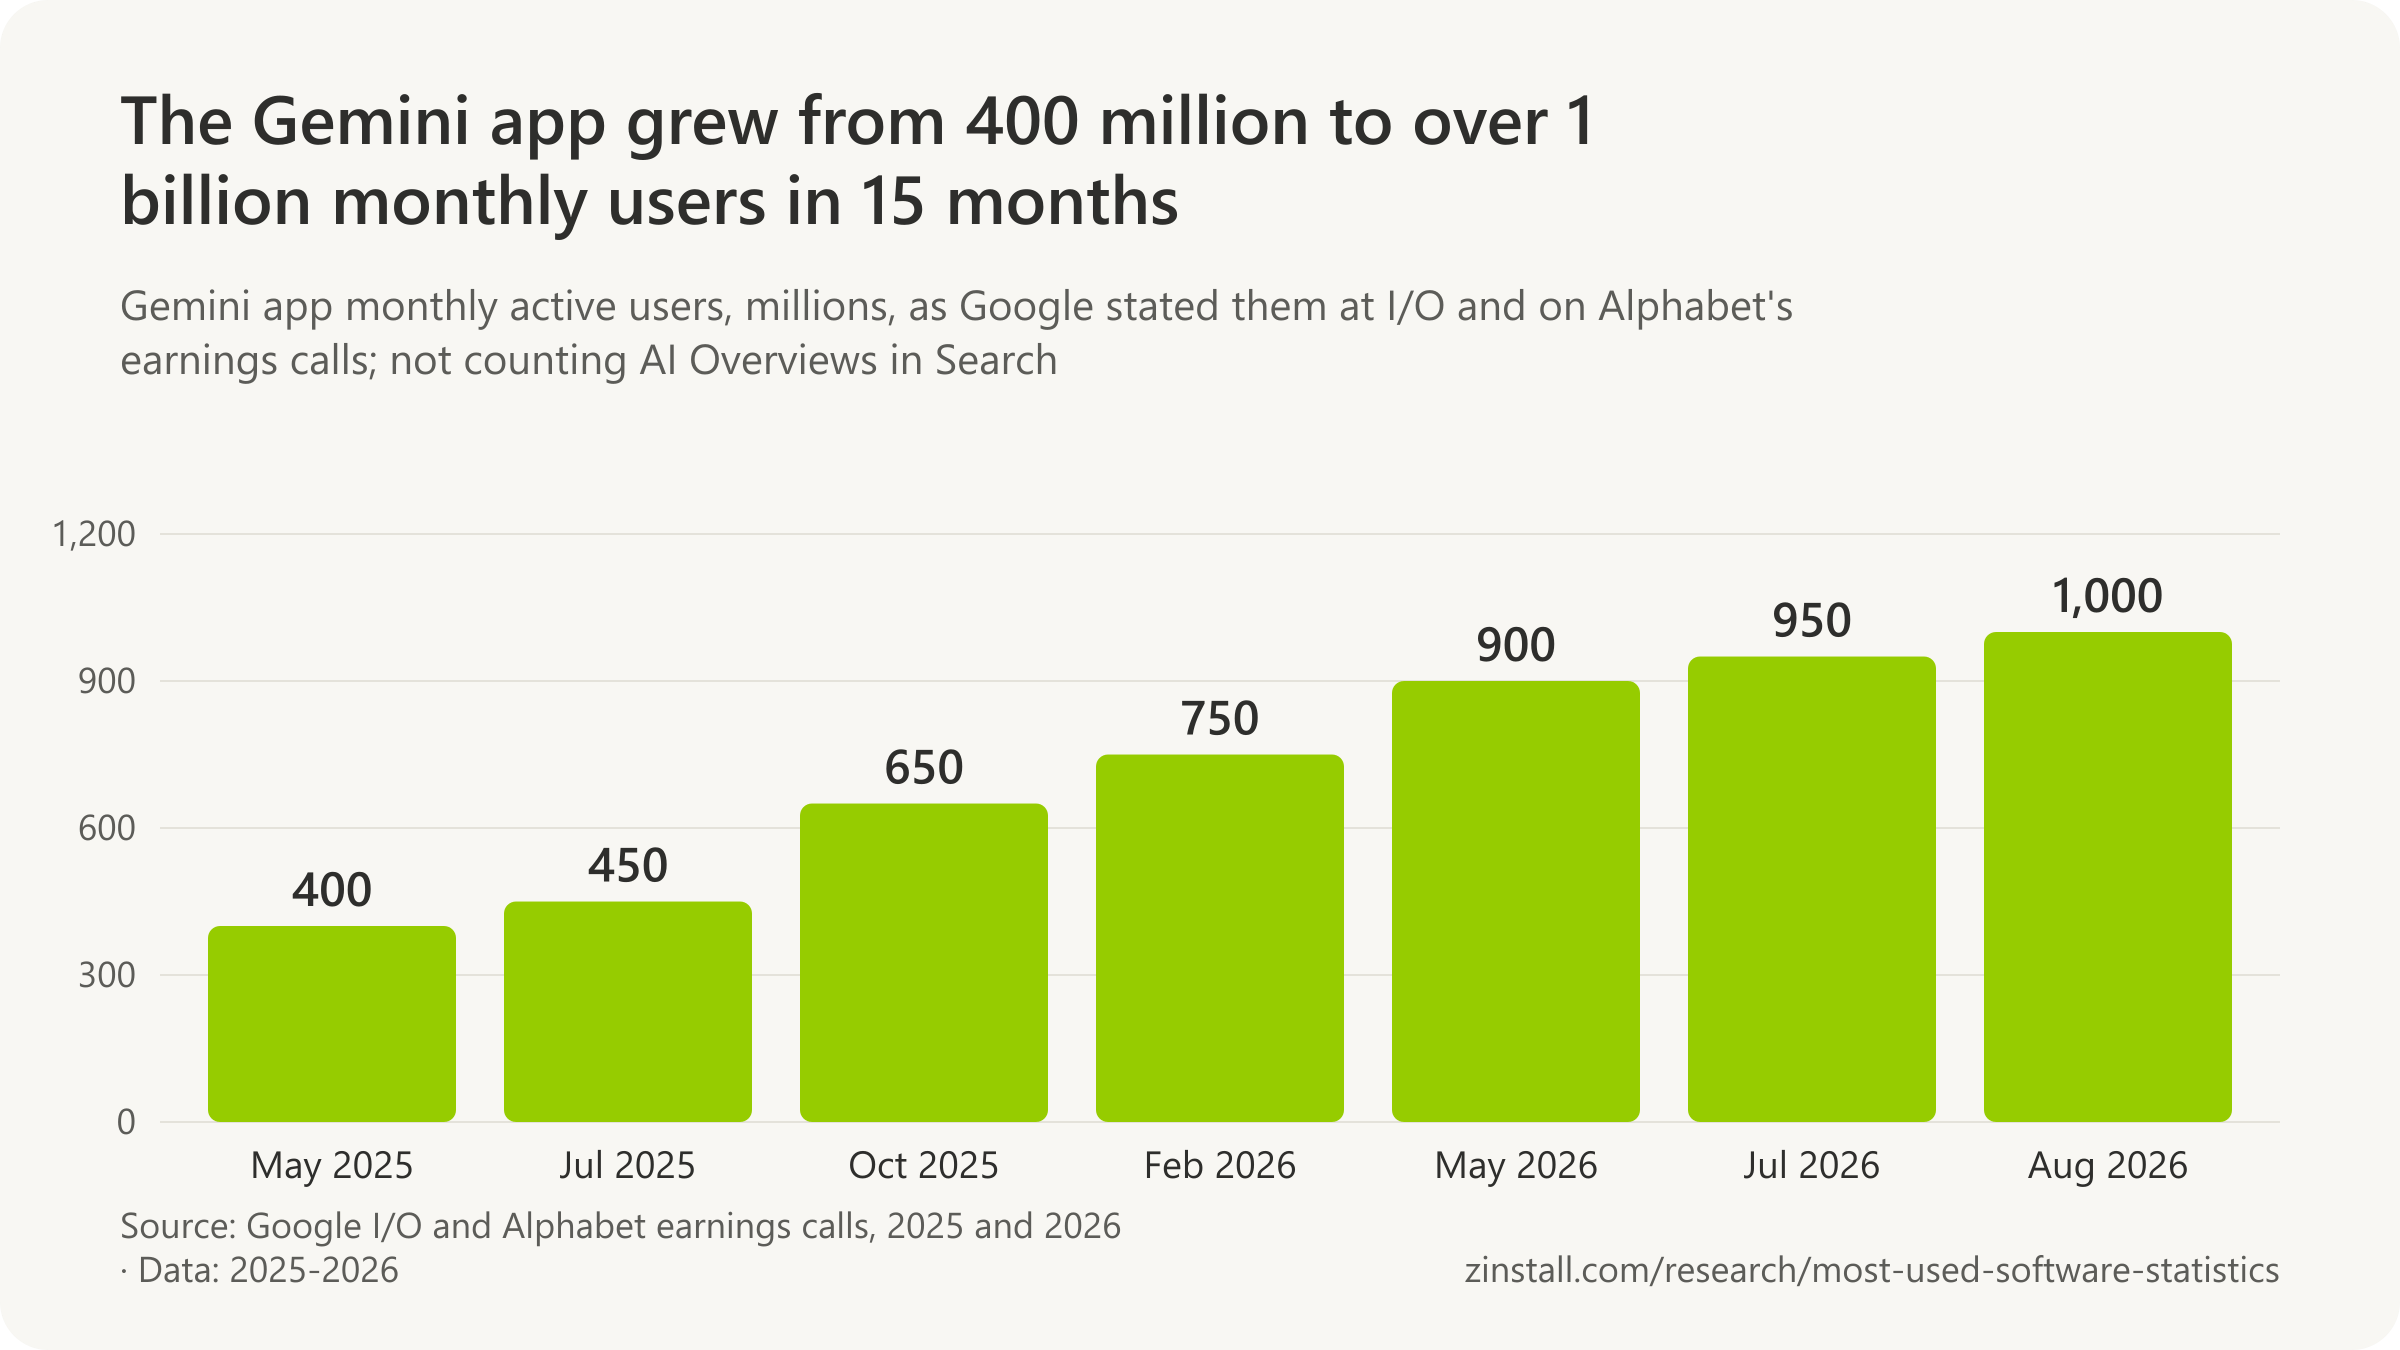
- Over 400 million monthly active users used the Gemini app worldwide in May 2025, Google CEO Sundar Pichai said in his I/O 2025 keynote, the first public user count Google gave for the app (Google, 2025).
- More than 450 million monthly active users used the Gemini app worldwide in July 2025, Sundar Pichai said on Alphabet's second-quarter 2025 earnings call (Alphabet, 2025).
- Over 650 million monthly active users used the Gemini app worldwide in October 2025, with queries up threefold from the previous quarter, Sundar Pichai said on Alphabet's third-quarter 2025 earnings call (Alphabet, 2025).
- Over 750 million monthly active users used the Gemini app worldwide in February 2026, Sundar Pichai said on Alphabet's fourth-quarter 2025 earnings call (Alphabet, 2026).
- Over 900 million monthly active users used the Gemini app worldwide in May 2026, more than double the 400 million of a year earlier, Sundar Pichai said in his I/O 2026 keynote (Google, 2026).
- 950 million monthly active users used the Gemini app worldwide in July 2026, with daily active users tripling in a year, Sundar Pichai said on Alphabet's second-quarter 2026 earnings call (Alphabet, 2026).
- Over 1 billion monthly active users used the Gemini app worldwide in August 2026, making it the fastest-growing product in Google's history by the company's own account (Google, 2026).
- Over 2.5 billion monthly active users were counted for AI Overviews in Google Search worldwide in May 2026, Sundar Pichai said at I/O 2026, a feature shown on results pages rather than an assistant people open (Google, 2026).
- Over 1 billion monthly active users used AI Mode, the conversational search mode in Google Search, worldwide in July 2026, Sundar Pichai said on Alphabet's second-quarter 2026 earnings call (Alphabet, 2026).
- 350 million monthly active users used Gemini worldwide in March 2025, according to Google's internal data shown in the US search antitrust remedies hearing and reported by TechCrunch (TechCrunch, 2025).
- 90 million monthly users used Gemini worldwide in October 2024, according to Google's internal data revealed in the US search antitrust remedies hearing, as reported by 9to5Google (9to5Google, 2025).
- 35 million daily active users used Gemini worldwide in late March 2025, nearly four times the 9 million of October 2024, according to a Google slide displayed in the US search antitrust remedies hearing (Business Insider, 2025).
- 9 million daily active users used Gemini worldwide in October 2024, according to a Google slide displayed in the US search antitrust remedies hearing in April 2025 (Business Insider, 2025).
- 800 million monthly active users was Google's own estimate for Meta AI in March 2025, shown on a slide in the US search antitrust remedies hearing, above the 700 million Meta itself had last reported (Business Insider, 2025).
- 600 million monthly active users was Google's own estimate for ChatGPT in March 2025, shown on a slide in the US search antitrust remedies hearing, a monthly measure OpenAI itself does not publish (Business Insider, 2025).
Meta AI

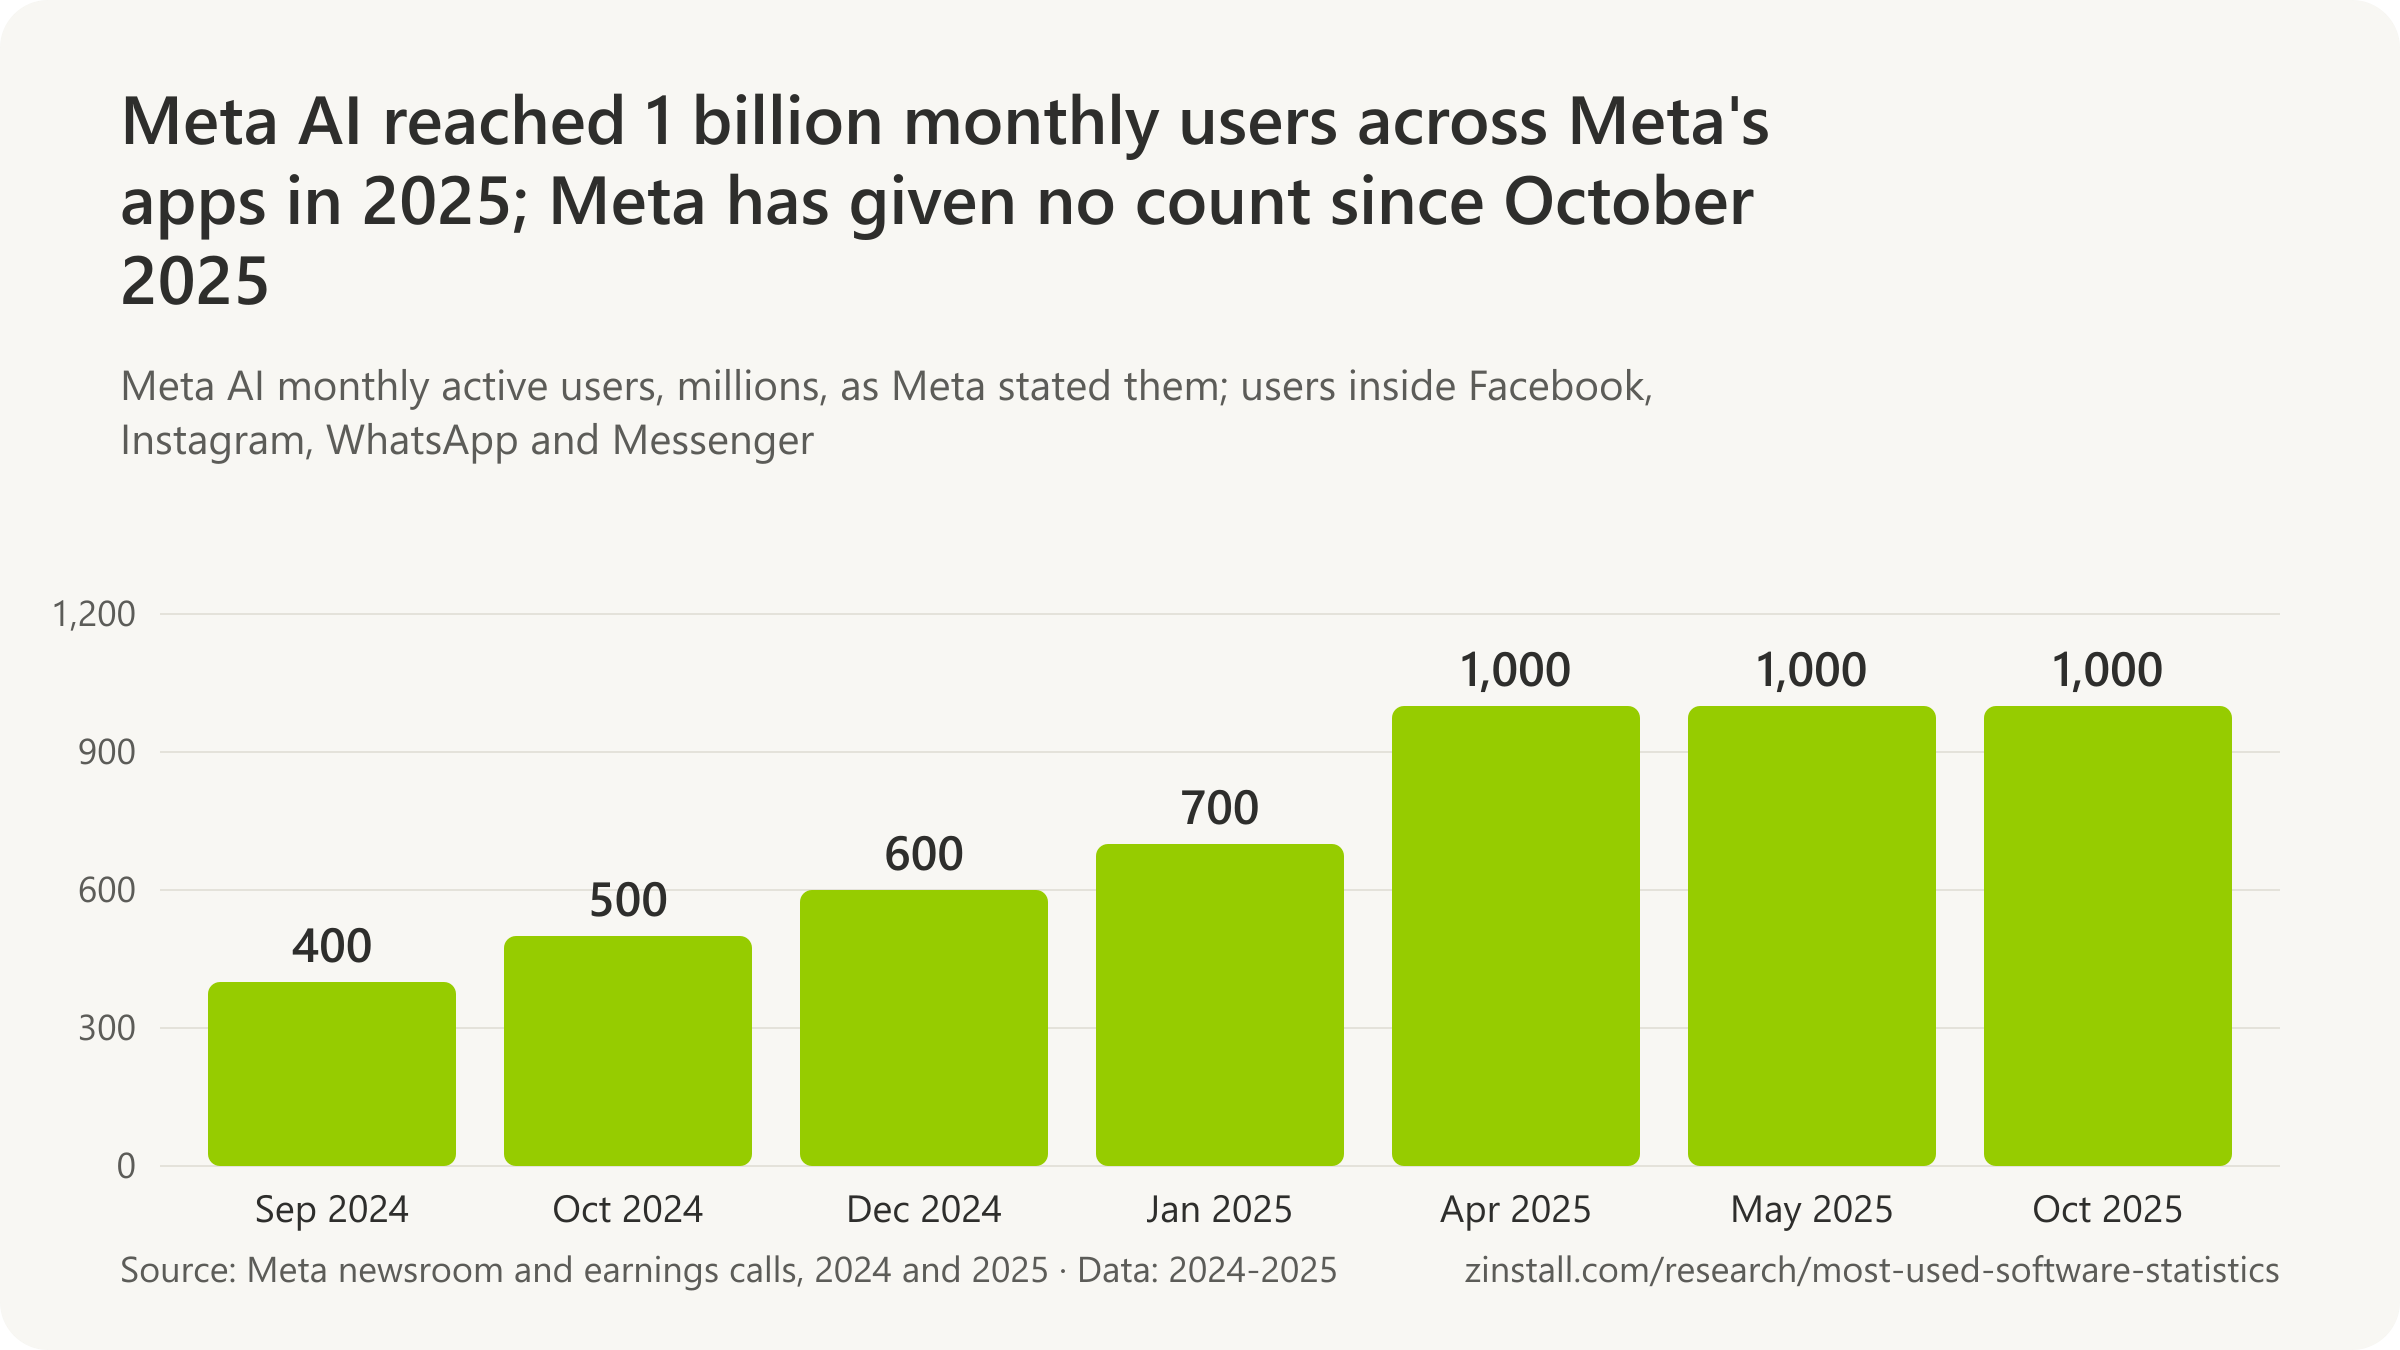
- More than 400 million people used Meta AI monthly across Meta's apps in September 2024, Meta said in its Connect 2024 product announcement (Meta, 2024).
- 185 million people used Meta AI each week across Meta's apps in September 2024, by Meta's count, the only weekly figure Meta has given for its assistant (Meta, 2024).
- Almost 500 million monthly active users used Meta AI across Meta's apps in September 2024, Mark Zuckerberg said on stage at Meta Connect 2024, as reported by TechCrunch (TechCrunch, 2024).
- Over 500 million monthly active users used Meta AI across Meta's apps in October 2024, CFO Susan Li said on Meta's third-quarter 2024 earnings call (Meta, 2024).
- Nearly 600 million monthly users used Meta AI across Meta's apps in December 2024, Mark Zuckerberg said in a video update reported by Engadget (Engadget, 2024).
- More than 700 million monthly active users used Meta AI across Meta's apps in January 2025, Mark Zuckerberg said on Meta's fourth-quarter 2024 earnings call (Meta, 2025).
- Almost 1 billion monthly active users used Meta AI across Meta's apps in April 2025, Mark Zuckerberg said on Meta's first-quarter 2025 earnings call (Meta, 2025).
- More than 1 billion monthly active users used Meta AI across Meta's apps in October 2025, Mark Zuckerberg said on Meta's third-quarter 2025 earnings call, the latest user count Meta has given for its assistant (Meta, 2025).
- 60% more people interacted with Meta AI each day after Meta rebuilt the assistant on its Muse Spark model in 2026, Mark Zuckerberg said on Meta's second-quarter 2026 earnings call, without giving a user count (Meta, 2026).
Claude, Perplexity and DeepSeek
- Over 300,000 business customers used Anthropic's Claude in September 2025, by Anthropic's own count in its Series F funding announcement, the last total customer figure it has given (Anthropic, 2025).
- Over 500 business customers were each spending more than $1 million a year on Claude in February 2026, up from about a dozen two years earlier, and eight of the Fortune 10 were Claude customers, Anthropic said (Anthropic, 2026).
- Over 1,000 business customers were each spending more than $1 million a year on Claude in April 2026, double the 500 Anthropic reported in February 2026, by Anthropic's count (Anthropic, 2026).
- No count of Claude's consumer users has been published by Anthropic: in March 2026 a spokesperson told TechCrunch only that paid Claude subscriptions had more than doubled that year, while outside estimates ranged from 18 million to 30 million users (TechCrunch, 2026).
- 452% year-on-year growth in Claude's True Audience (unique users across mobile app and web) was estimated by Sensor Tower for May 2026, with Claude's US share of AI assistant users rising from 4.4% to nearly 14% over the same year (Sensor Tower, 2026).
- 950.2 million visits were made to claude.ai in August 2026, 562% more than a year earlier and the 35th most visited website in the world, by Similarweb's estimate (Similarweb, 2026).
- 353.8 million visits were made to deepseek.com in August 2026, 13.1% fewer than a year earlier, the 89th most visited website in the world, by Similarweb's estimate (Similarweb, 2026).
- 10 million monthly active users used Perplexity's answer engine in January 2024, a year after its public launch, the company said when announcing its Series B funding (Perplexity, 2024).
- Over 500 million queries were answered by Perplexity in 2023, the company said in January 2024 (Perplexity, 2024).
- 100 million queries a week were being answered by Perplexity in October 2024, up from 250 million a month in July, its chief executive Aravind Srinivas said, as reported by TechCrunch (TechCrunch, 2024).
- 780 million queries were answered by Perplexity in May 2025, growing more than 20% a month, with about 30 million a day, its chief executive Aravind Srinivas said at Bloomberg's Tech Summit (TechCrunch, 2025).
- Over 100 million monthly active users were claimed for Perplexity across its products by company executives in April 2026, as reported by the Financial Times and relayed by Tech in Asia (Tech in Asia via TechLeap, 2026).
- 608 billion input tokens and 168 billion output tokens were processed by DeepSeek's V3 and R1 services across its web, app and API in the 24 hours to noon (Beijing time) on 28 February 2025, DeepSeek said; it publishes no user count (DeepSeek, 2025).
Which chatbots send visitors to websites

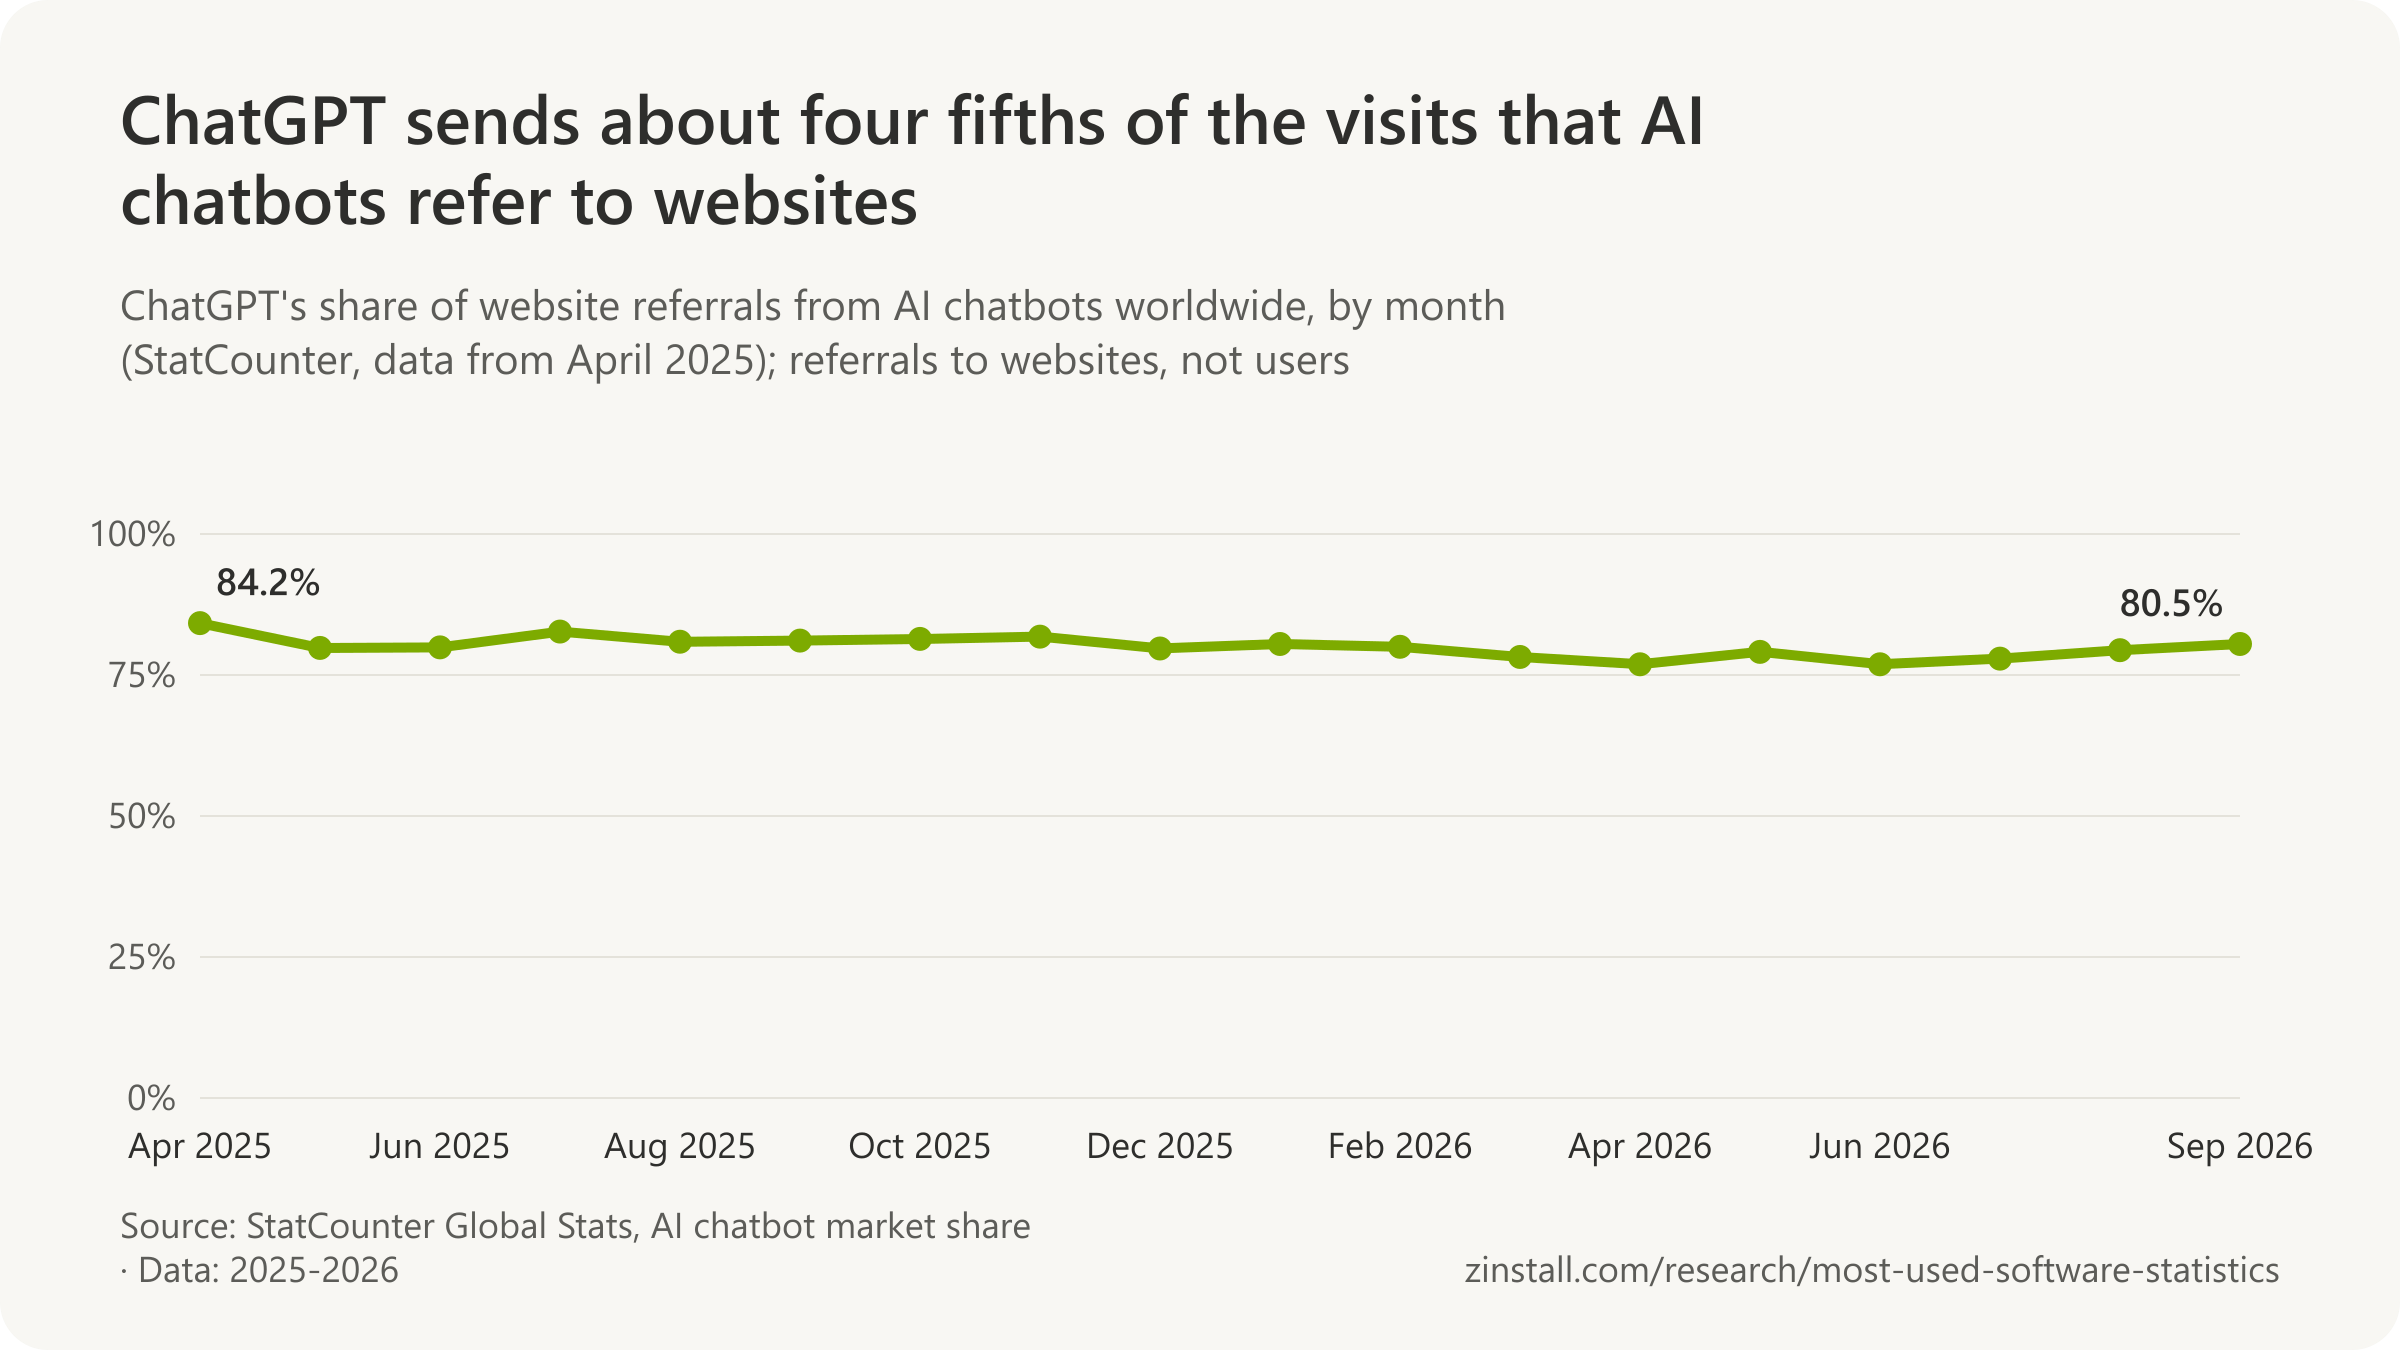
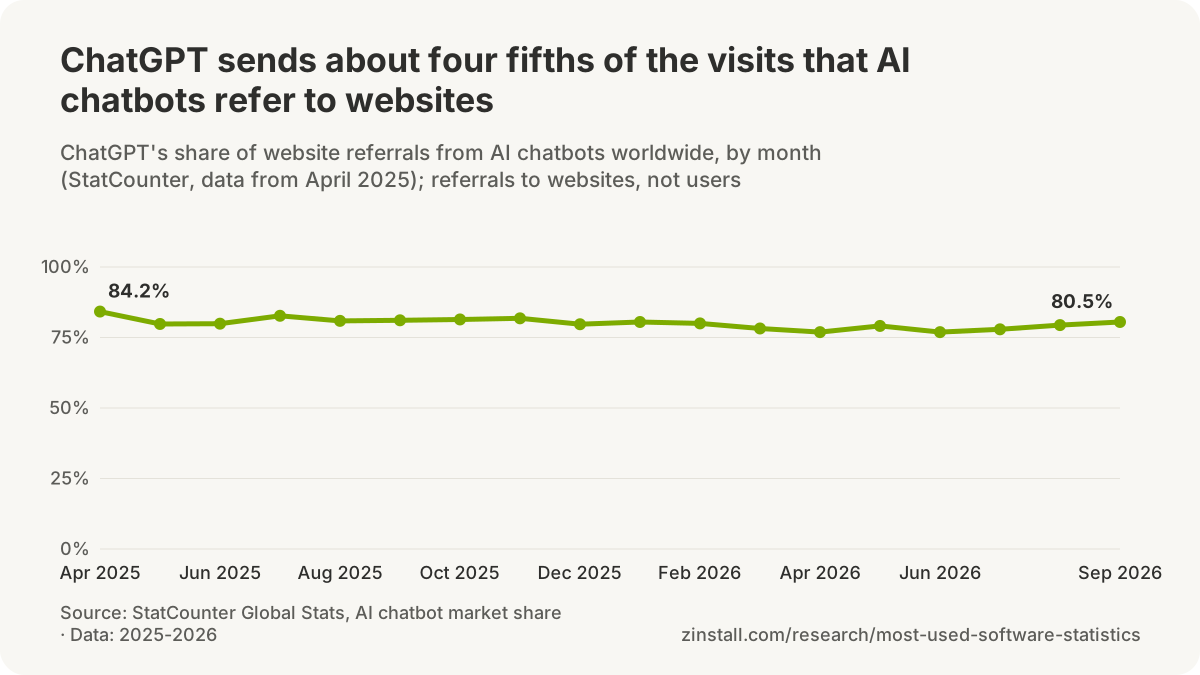
| Chatbot and month | Share of referrals |
|---|---|
| Perplexity, September 2025 | 10.9% |
| Gemini, September 2025 | 2.8% |
| Copilot, September 2025 | 4.0% |
| Claude, September 2025 | 1.0% |
| DeepSeek, September 2025 | 0.2% |
| Gemini, September 2026 | 10.9% |
| Perplexity, September 2026 | 5.9% |
| Copilot, September 2026 | 1.8% |
| Claude, September 2026 | 1.0% |
| DeepSeek, September 2026 | less than 0.1% |
- Referrals from individual AI chatbots to websites, not users or queries, are what StatCounter counts in the AI chatbot market share it launched on 11 June 2025, with Grok left out because it sends no referral data (StatCounter, 2025).
- 89.3% of AI chatbot referrals to websites in China came from DeepSeek in May 2025, the one G20 country where ChatGPT did not lead StatCounter's AI chatbot referral data (StatCounter, 2025).
- 8.7% of AI chatbot referrals to websites worldwide came from Google Gemini in March 2026, overtaking Perplexity (7.1%) for second place behind ChatGPT for the first time in StatCounter's data (StatCounter, 2026).
- 2.9% of AI chatbot referrals to websites worldwide came from Claude in March 2026, more than double its 1.4% in February, which StatCounter linked to users switching from ChatGPT; its weekly share peaked at 3.6% in mid-March (StatCounter, 2026).
- 75.2% of AI chatbot referrals to websites in the United States came from ChatGPT in September 2026, against 13.3% from Google Gemini, 6.6% from Microsoft Copilot, 3.0% from Perplexity and 1.8% from Claude (StatCounter, 2026).
Surveys: who uses AI chatbots and AI at work

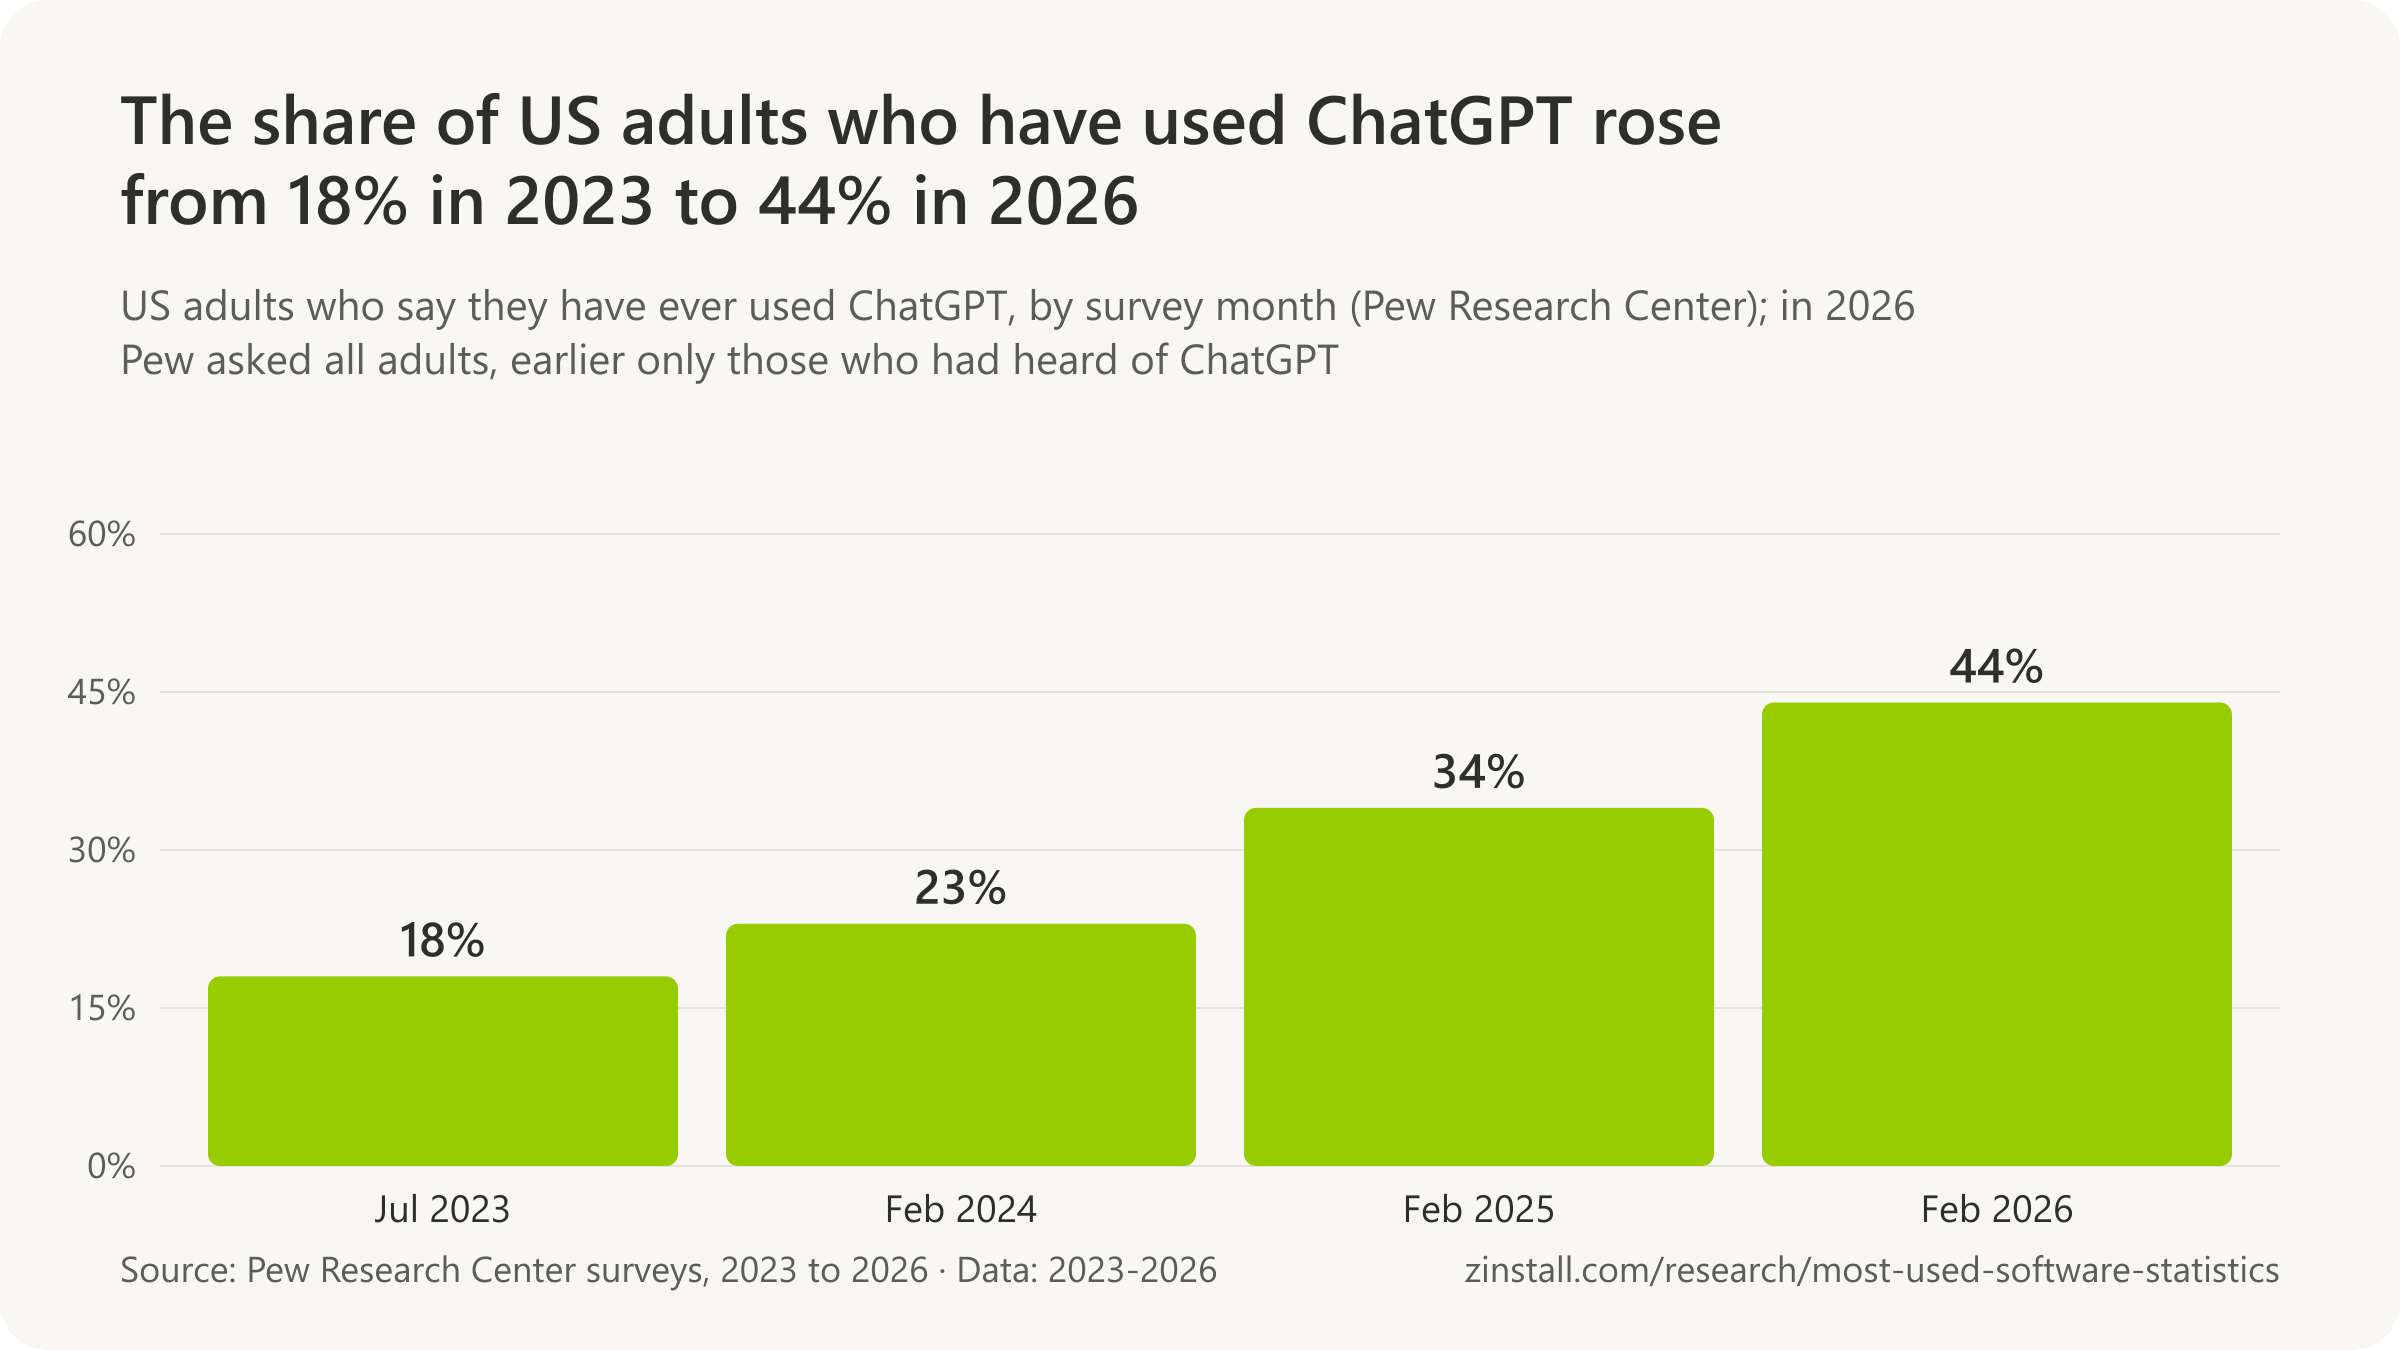
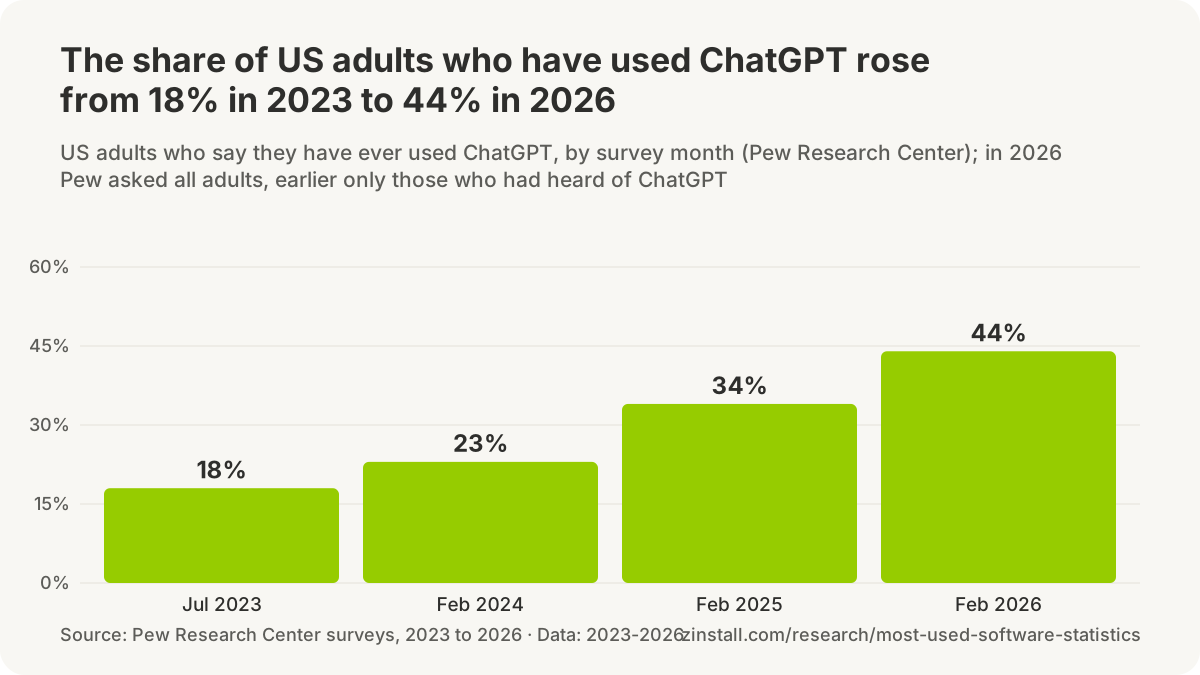
- 14% of U.S. adults had used ChatGPT for entertainment, to learn something new or for work in March 2023, Pew Research Center's first measure of use, four months after the chatbot's launch (Pew Research Center, 2023).
- 18% of U.S. adults had ever used ChatGPT in July 2023 (24% of those who had heard of it), according to a Pew Research Center survey of 5,057 adults (Pew Research Center, 2023).
- 23% of U.S. adults had ever used ChatGPT in February 2024, up from 18% in July 2023, according to a Pew Research Center survey of 10,133 adults (Pew Research Center, 2024).
- 34% of U.S. adults had ever used ChatGPT in February and March 2025, about double the share in 2023, according to a Pew Research Center survey of 5,123 adults (Pew Research Center, 2025).
- 58% of U.S. adults under 30 had ever used ChatGPT in early 2025, up from 43% in 2024 and 33% in 2023, against 10% of those 65 and older (Pew Research Center, 2025).
- 28% of employed U.S. adults had used ChatGPT for tasks at work by early 2025, up from 8% in March 2023, Pew Research Center found (Pew Research Center, 2025).
- 44% of U.S. adults said they ever use ChatGPT in February 2026, up from 34% a year earlier and more than double the 2023 share, in Pew Research Center's survey of 5,119 adults (Pew Research Center, 2026).
- 61% of U.S. adults under 30 said they ever use ChatGPT in February 2026, against 55% of those 30 to 49, 37% of those 50 to 64 and 19% of those 65 and older (Pew Research Center, 2026).
- 49% of U.S. adults said they ever use AI chatbots such as ChatGPT, Gemini or Copilot in February 2026, up from 33% in August 2024, in Pew Research Center's survey of 5,119 adults (Pew Research Center, 2026).
- 24% of U.S. adults said they use AI chatbots daily in February 2026, including 12% several times a day and 4% almost constantly, while 51% did not use chatbots at all (Pew Research Center, 2026).
- 24% of U.S. adults said they ever use Google's Gemini chatbot in February 2026, the second most used chatbot after ChatGPT (44%) in Pew Research Center's survey of 5,119 adults (Pew Research Center, 2026).
- 17% of U.S. adults said they ever use Microsoft's Copilot chatbot in February 2026, against 44% for ChatGPT, in Pew Research Center's survey of 5,119 adults (Pew Research Center, 2026).
- 14% of U.S. adults said they ever use Meta AI in February 2026, against 44% for ChatGPT, in Pew Research Center's survey of 5,119 adults (Pew Research Center, 2026).
- 6% of U.S. adults said they ever use Anthropic's Claude in February 2026, against 8% for Grok, 3% for Character.ai and 44% for ChatGPT, in Pew Research Center's survey of 5,119 adults (Pew Research Center, 2026).
- 38% of employed U.S. adults said they use AI chatbots for tasks at work in February 2026, and 42% of all adults use them to search for information (Pew Research Center, 2026).
- 26% of U.S. teens aged 13 to 17 said they had used ChatGPT for their schoolwork in autumn 2024, double the 13% of 2023, in a Pew Research Center survey of 1,391 teens (Pew Research Center, 2025).
- 33% of U.S. adults under 30 had ever used ChatGPT in July 2023, Pew Research Center's first measure of the 'ever used' question (Pew Research Center, 2025).
- 43% of U.S. adults under 30 had ever used ChatGPT in February 2024, up 10 points since July 2023, against 6% of those 65 and older (Pew Research Center, 2024).
- 33% of U.S. adults had ever used an AI chatbot such as ChatGPT, Gemini or Copilot in August 2024, as Pew Research Center reported alongside its 2026 figure of 49% (Pew Research Center, 2026).

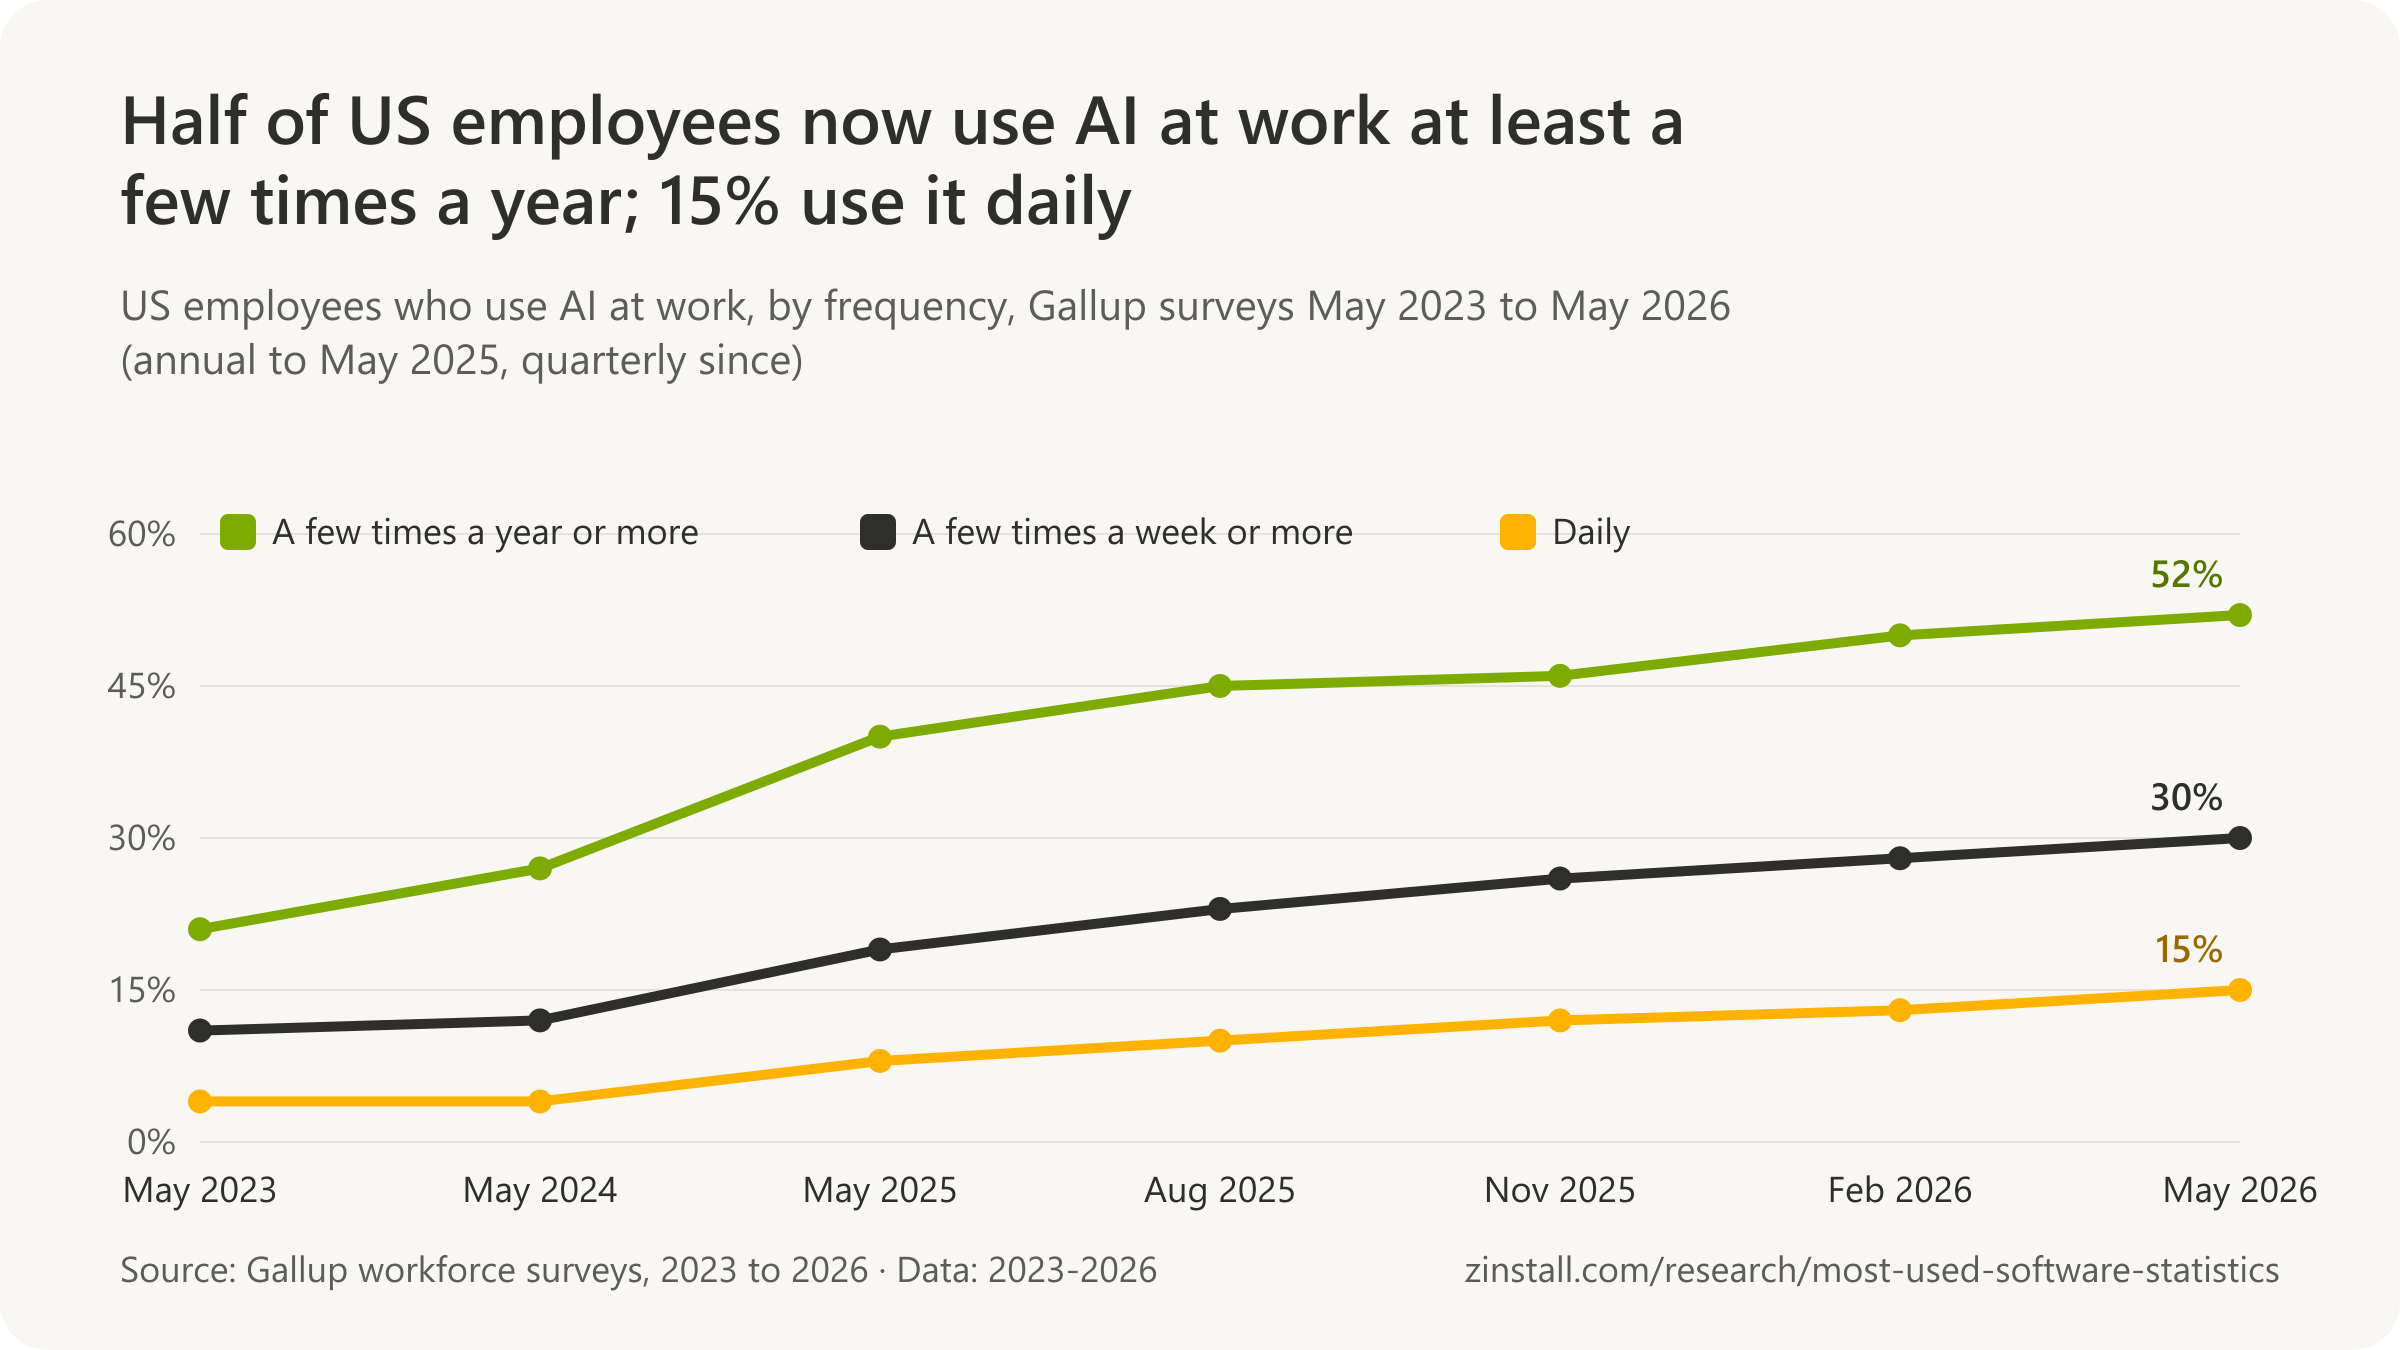
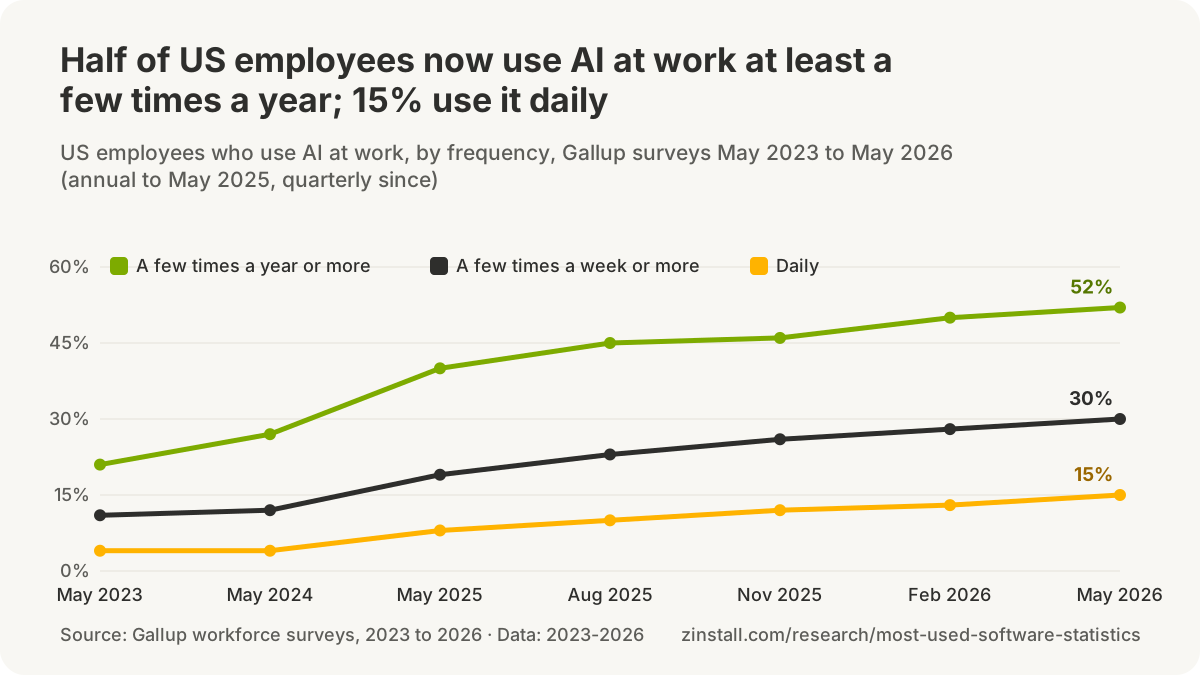
- 36% of U.S. adults said they had used an AI-enabled product in the past seven days in late 2024, although 99% had used at least one product type with AI features, in a Gallup and Telescope study of 3,975 adults (Gallup, 2025).
| Country, measure and year | Share of adults |
|---|---|
| Six countries: weekly use of any generative AI, 2024 | 18% |
| Six countries: weekly use of any generative AI, 2025 | 34% |
| Six countries: ever used generative AI, 2024 | 40% |
| Six countries: ever used generative AI, 2025 | 61% |
| Six countries: weekly use of ChatGPT, 2024 | 11% |
| Six countries: weekly use of ChatGPT, 2025 | 22% |
| Six countries: weekly use of Google Gemini, 2025 | 11% |
| Six countries: weekly use of Meta AI, 2025 | 9% |
| Six countries: weekly use of Microsoft Copilot, 2025 | 6% |
| UK: weekly use of any generative AI, 2025 | 28% |
| UK: weekly use of ChatGPT, 2025 | 17% |
| USA: weekly use of any generative AI, 2025 | 36% |
| USA: weekly use of ChatGPT, 2025 | 22% |
| France: weekly use of any generative AI, 2025 | 27% |
| France: weekly use of ChatGPT, 2025 | 18% |
| Denmark: weekly use of any generative AI, 2025 | 34% |
| Denmark: weekly use of ChatGPT, 2025 | 28% |
| Japan: weekly use of any generative AI, 2025 | 26% |
| Japan: weekly use of ChatGPT, 2025 | 16% |
| Argentina: weekly use of any generative AI, 2025 | 51% |
| Argentina: weekly use of ChatGPT, 2025 | 31% |
- 7% of people in the USA used ChatGPT daily in spring 2024, against 2% in France and the UK and 1% in Japan, in the Reuters Institute's six-country survey (Reuters Institute, 2024).
- 7% of people across the Digital News Report's 48 markets used AI chatbots for news each week in early 2025, and 15% of under-25s, the first time the Reuters Institute asked (Reuters Institute, 2025).
- 10% of people across the Digital News Report's 48 markets used AI chatbots such as ChatGPT, Perplexity and Gemini for news each week in early 2026, up from 7% a year earlier, and 16% of under-35s (Reuters Institute, 2026).
- 75% of knowledge workers in 31 countries said they used generative AI at work in early 2024, nearly half of them for less than six months, in Microsoft and LinkedIn's vendor-sponsored Work Trend Index survey of 31,000 people (Microsoft, 2024).
- 78% of knowledge workers who used AI at work were bringing their own AI tools rather than company-provided ones in early 2024, rising to 80% at small and medium-sized companies, in Microsoft and LinkedIn's Work Trend Index survey (Microsoft, 2024).
- 45% of employees and 69% of leaders among knowledge workers in 31 countries said they used generative AI at work at least several times a week in early 2025, in Microsoft's vendor-sponsored Work Trend Index survey of 31,000 workers (Microsoft, 2025).
- 18.8% of the world's working-age population (ages 15 to 64) used a generative AI product in June 2026, up from 17.8% in the first quarter and 16.3% in the second half of 2025, by Microsoft's telemetry-based estimate (Microsoft, 2026).
- 33.0% of working-age people in the United States used a generative AI product in June 2026, up from 31.3% in the first quarter, placing the US 21st among economies by Microsoft's telemetry-based estimate (Microsoft, 2026).
Numbers in circulation
- 800 million weekly active users was Mary Meeker's BOND estimate for ChatGPT in April 2025, read from Sam Altman's TED remarks when OpenAI's last stated figure was 500 million (BOND, 2025).
- 800 million weekly users by April 2025 is the ChatGPT figure Exploding Topics still attributes to Mary Meeker's AI report in October 2026, an estimate OpenAI never stated (Exploding Topics, 2026).
- 100 million users in two months is how Exploding Topics summarises ChatGPT's early growth in October 2026, dropping that the figure was a UBS estimate of monthly users from Similarweb traffic data (Exploding Topics, 2026).
- 900 million weekly active users is the current ChatGPT figure on DemandSage's statistics page updated 26 September 2026, after OpenAI had already reported more than 1 billion (DemandSage, 2026).
- 5.51 billion is the April 2026 ChatGPT 'MAU (monthly visits)' on DemandSage's statistics page, a count of website visits labelled as monthly active users (DemandSage, 2026).
- Over 900 million weekly active users is the latest ChatGPT figure on Backlinko's statistics page published 9 September 2026, nine days after OpenAI reported more than 1 billion (Backlinko, 2026).
- 1 billion monthly users is the ChatGPT figure GeekWire gave in August 2026, a Sensor Tower estimate of monthly users of the ChatGPT app reported without the 'app' or 'estimate' (GeekWire, 2026).
- 38.5 million monthly users of Microsoft's consumer Copilot app in July 2026 is a Sensor Tower estimate reported by GeekWire, which notes that Microsoft does not disclose the app's user numbers (GeekWire, 2026).
- 20 million paid Copilot users is how TechCrunch's April 2026 headline restated Microsoft's over 20 million paid Microsoft 365 Copilot seats, turning seats into users (TechCrunch, 2026).
- More than 20 million enterprise users paying for Copilot, up from 15 million paying customers in January, is how Computerworld restated Microsoft's paid Microsoft 365 Copilot seat counts in May 2026, citing TechCrunch rather than Microsoft (Computerworld, 2026).
- 218 million active users across Windows, app and website in 2025 is Business of Apps' current estimate for Microsoft Copilot, which it raised from the 33 million it gave for the first half of 2025 a year earlier, without publishing a method (Business of Apps, 2026).
- 33 million active users across Windows, Microsoft 365, web and mobile is the Copilot figure SeoProfy's 2026 statistics roundup puts first, taken from a Business of Apps estimate rather than from Microsoft (SeoProfy, 2026).
- 35 million daily active users is the Gemini figure Demandsage gives for the end of 2025, but it traces to Google's internal data for March 2025 shown in court; Google has published no daily user count since (Demandsage, 2026).
- 2 billion monthly users of AI Overviews are counted by Demandsage as reach 'just because of Google Gemini', a July 2025 figure for a Google Search feature that Google had raised to over 2.5 billion by May 2026 (Demandsage, 2026).
- 3.48 billion people a day use Meta AI by Demandsage's account, but 3.48 billion is Meta's June 2025 count of daily active people across its whole family of apps, not a count of Meta AI users (Demandsage, 2025).
- Over 1 billion monthly active users of Meta AI in the first quarter of 2025 is how Demandsage dates the milestone, but Meta said 'almost a billion' on 30 April 2025, 1 billion on 28 May 2025 and 'more than a billion' only in October 2025 (Demandsage, 2025).
- 45 million monthly active users is the Perplexity figure repeated by roundups such as DemandSage in 2026, sourced to Wired, Similarweb and Business of Apps rather than to any Perplexity statement (DemandSage, 2026).
- 96.88 million monthly active users in April 2025 is the DeepSeek figure most repeated by roundups such as Backlinko, sourced to the Chinese AI ranking site aicpb.com rather than to DeepSeek, which publishes no user count (Backlinko, 2026).
- 271.3 million monthly active users is the Claude figure DemandSage gave in October 2026, a total of third-party estimates for web, app and Claude Code that Anthropic has never published (DemandSage, 2026).
- 5% of knowledge workers use AI at work is how Mailmodo's 2026 roundup of AI workplace statistics gives Microsoft's 2024 Work Trend Index figure, which is 75%, the first digit lost (Mailmodo, 2026).
- 34% of US adults have used ChatGPT is the Pew figure Wisernotify's 'How Many People Use ChatGPT? 2026 Statistics' still gave in its July 2026 update, a month after Pew published 44% for February 2026 (Wisernotify, 2026).
Sources: OpenAI (2024, 2025, 2026); Sam Altman on X; Reuters; TechCrunch (2023-2026); Bloomberg News; Axios; VentureBeat; The Verge; CNBC (2025); TED; National Bureau of Economic Research; Sensor Tower (2026); Similarweb (2023-2026); Microsoft (2023-2026); GeekWire; Google (2025, 2026); Alphabet (2025, 2026); 9to5Google; Business Insider; Meta (2024, 2025, 2026); Engadget; Anthropic (2025, 2026); Perplexity; Tech in Asia; DeepSeek; StatCounter (2025, 2026); Pew Research Center (2023-2026); Gallup (2025, 2026); Reuters Institute for the Study of Journalism (2024, 2025, 2026); Microsoft and LinkedIn; BOND; Exploding Topics; DemandSage (2025, 2026); Backlinko (2026); Computerworld; Business of Apps; SeoProfy; Mailmodo; Wisernotify
Data. All 1,264 statistics on this page, each with its source, verbatim quote and locator: CSV · JSON. Charts and figures on this page may be reused with a link to https://www.zinstall.com/research/most-used-software-statistics as the source. Original publishers retain attribution.
Data behind each chart (CSV, 47 files)
- Chrome was on nine in ten PCs in the last census of installed programs
- Microsoft 365 business seats grew from 258 million to more than 450 million in under six years
- Office 2016 is still the most common version at small German firms; Office 2021 runs on 15%
- Apache OpenOffice downloads fell from 54 million in 2013 to under 12 million in 2025
- Chrome's share of web browsing doubled from 2012 to 2020 and has held at about two thirds since
- Teams reached 320 million monthly users in 2023; Microsoft has published no count since
- The average company in Okta's network uses about 100 apps, up from 72 in 2016
- The installed TurboTax software still recorded 4.1 million US federal units in 2026, down from 4.9 million
- Acrobat and Adobe Express passed 900 million monthly users in 2026
- ChatGPT grew from 100 million to 1.2 billion weekly users in under three years
- Microsoft 365 consumer subscribers passed 90 million in 2026, up from 5.6 million in 2014
- Office 365 had 200 million monthly business users in 2019; Microsoft has since reported seats instead
- At small German firms, Office 2019 and 2021 replaced Office 2010 and 2013 while Office 2016 held at about a third
- On-premises Office and Windows revenue rose 17% before Office 2016's end of support, led by Office 2024 sales
- Google Workspace had more than 13 million customers in 2026, up from 2 million in 2015
- On desktops, Chrome took Internet Explorer's place and Edge is now second
- Windows still accounts for three quarters of desktop web browsing, down from nine tenths in 2012
- Firefox has about 210 million monthly users on desktop and mobile, by Mozilla's count
- Opera's PC browsers grew from 61 million to 86 million monthly users between 2018 and 2025
- Brave passed 100 million monthly users in 2025 and 128 million in 2026
- Cloudflare's traffic shows the same picture: Chrome at about two thirds
- Apple's mail apps record the most email opens; Outlook on the desktop has fallen to about 6%
- Teams daily users grew elevenfold between July 2019 and April 2021
- Slack had 169,000 paid customers when it last reported, in April 2021
- Zoom's enterprise customers peaked at 220,400 in 2024; Zoom stopped reporting the count in 2025
- Thunderbird runs on about 15 million installations a month, close to its level five years ago
- Gmail had 1.5 billion monthly users in 2018, the last count Google published
- QuickBooks Online grew to 4.5 million subscribers by 2019, the last count Intuit published
- Americans self-prepare and e-file about 67 million tax returns a year
- TurboTax records about 39 million US federal units a year
- Xero had 4.92 million customers in March 2026
- Autodesk's paid subscriptions more than quadrupled from 2014 to 2025; it has published no count since
- Adobe last counted Creative Cloud subscriptions in 2015, at 6.2 million
- Canva grew from 1.5 million to 260 million monthly users in ten years
- Spotify reached 777 million monthly users in 2026
- Apple Music had 50 million paid subscribers in 2019, the last paid-only count
- VLC has been downloaded more than 7 billion times
- The Gemini app grew from 400 million to over 1 billion monthly users in 15 months
- Meta AI reached 1 billion monthly users across Meta's apps in 2025; Meta has given no count since October 2025
- Microsoft 365 Copilot doubled to more than 30 million paid seats in six months
- GitHub Copilot had 4.7 million paid subscribers at the end of 2025
- The share of US adults who have used ChatGPT rose from 18% in 2023 to 44% in 2026
- Half of US employees now use AI at work at least a few times a year; 15% use it daily
- ChatGPT sends about four fifths of the visits that AI chatbots refer to websites
- Dropbox's paying users levelled off at about 18 million
- Word, Chrome and Firefox were each on about two thirds or more of the PCs Flexera's scanner checked
- 7-Zip's downloads from SourceForge peaked at almost 100 million in 2011
Methodology
What we included. Figures published by the software makers themselves (earnings releases, annual reports and filings, official blogs and statistics pages), by measurement services that describe their method (StatCounter, Cloudflare Radar, Litmus, Okta Businesses at Work, Similarweb, Sensor Tower), by public surveys (Pew Research Center, Gallup, the Reuters Institute, IRS filing statistics) and by security vendors' scans of their own users' PCs (Avast, Flexera), each in the measure its publisher used; restatements in the press and on roundup sites, traced to their source; and sums of published daily download counts, labelled as derived. Official statistics, the trackers' own publications, company filings and transcripts, and peer-reviewed or analyst reports are preferred; vendor surveys and news reports are included only where no better source exists and are labelled as such in the dataset.
How each figure was verified. Every record carries the exact sentence or table cell from the source (the quote) and where it sits (the locator). A researcher confirmed each one against the source document; a script then re-fetched every source on October 14, 2026 and checked for the quote. Records the script could not confirm are kept only if the researcher's check was complete, and are marked for human review in the dataset. Restatements (a later outlet quoting an earlier figure) are recorded as restatements, with the primary figure alongside.
What we excluded. Figures whose only source is a roundup, a content farm or Statista (they appear only as restatement records, traced to what they cite); counts of companies 'using' a program from technographics vendors that publish no method, as findings; any ranking or total that mixes measures (users, seats, customers, downloads); and any first-party Zinstall data. Where a source gives a figure only in a form we could not confirm (for example, a chart with no data table), the record is marked unverified and is not exported.
Rounding and derivation. Numbers are reproduced as published. Where a tracker publishes two decimals, statements and table cells give one decimal, rounded half up, and the dataset keeps the published value. In the short sentences at the top of the page and of each section, large counts and money amounts may be rounded to two or three significant figures; the exact figure follows in the section's full statements and in the dataset. Derived figures (a change between two months, a share computed from two counts) say so and name their inputs. The bold figure in each statement is a reading aid, not an edit.
Updates. Sources are re-checked and new figures added quarterly, with the monthly tracker series topped up as they are published; the next scheduled refresh is January 2027, then quarterly (after the software makers' earnings releases). Corrections are welcome through the contact page.
Measures. Each figure is given in the measure its publisher used. Monthly or weekly active users count people (or accounts) who used a product in a period; paid seats count licences, which one person can hold several of and which can go unused; business customers count organisations; downloads and installs count copies, not people; page-view and email-open shares count activity in a tracker's sample. Where a maker stopped publishing a figure, the last one is shown with its date.
Cite this page
Zinstall. "How Many People Use Office, Chrome, Teams and ChatGPT? Statistics on the Most Used Software." https://www.zinstall.com/research/most-used-software-statistics. Updated 2026-10-14.
Frequently asked questions
What is the most used software in the world?
No source counts every program on every computer. The last census of installed programs, Avast's 2018 data from 163 million PCs, found Google Chrome on 91% of them, Adobe Acrobat Reader on 61%, WinRAR on 48% and Microsoft Office on 45%. By users, the largest counts software makers publish are Windows, on more than 1.6 billion monthly active devices, and ChatGPT, with more than 1.2 billion weekly users.
How many people use Microsoft Office?
Microsoft no longer gives a number of people. It reports more than 450 million paid Microsoft 365 business seats (December 2025) and nearly 95 million consumer subscribers (March 2026); a seat is a licence, and one person can hold several. Its last total of people, more than 1.2 billion, dates from 2015 and was repeated until 2018.
How many people still use Office 2021?
No count exists: Microsoft publishes none for any Office version. In the only regular survey, Intra2net's of small German firms without Microsoft 365, Office 2021 ran on 15% of on-premises Office PCs in September 2026, a month before its support ended on 13 October 2026. After that date, 82% of those PCs ran an Office version without security updates.
Are there more Office or OpenOffice users?
Office, by far, though no source counts both in the same measure. Microsoft reports more than 450 million paid business seats for Microsoft 365. Apache OpenOffice publishes only downloads: 11.6 million in 2025, and 404.8 million through SourceForge since May 2012. LibreOffice, the larger open-source suite, estimates its users at about 100 million, and WPS Office counts 676 million monthly active devices.
What is the most used web browser?
Chrome. It accounted for 66.4% of web page views worldwide in September 2026 across desktops, phones and tablets, and 65.1% on desktops, where Edge was second at 14.6% (StatCounter). Two thirds of the browser traffic reaching Cloudflare's network in 2025 also came from Chrome.
How many people use ChatGPT?
More than 1.2 billion people a week, OpenAI said in October 2026. OpenAI publishes weekly users only; the 'one billion monthly users' sometimes quoted is Sensor Tower's estimate for the mobile app. In the US, 44% of adults told Pew Research Center in February 2026 that they use ChatGPT.
What are the most used business apps?
Microsoft 365, by the number of companies that connect it through Okta's sign-on service: it has been first in every Businesses at Work report since it overtook Salesforce in January 2015, and in the 2026 report it led Google Workspace, AWS, Salesforce and Zoom. The average Okta customer used 98 apps.
Which sources should I cite for software usage statistics?
The software maker's own figure, with its measure and date: earnings releases and annual reports (Microsoft, Alphabet, Adobe, Intuit, Zoom, Spotify), official statistics pages (Mozilla, Thunderbird, VideoLAN, Apache OpenOffice), and measurement services that publish their method (StatCounter, Cloudflare Radar, Litmus, Okta). StatCounter, for one, counts page views, not people. Every figure on this page links its source; roundup sites appear only as restatements, traced to what they cite.
Sources: Avast; Microsoft (2015, 2024, 2026); OpenAI; Intra2net AG (2026); Apache OpenOffice; The Document Foundation; Kingsoft Corporation; StatCounter (2026); Cloudflare; Sensor Tower; Pew Research Center; Okta (2015, 2020, 2026); Litmus
Ready to transfer your programs and files?
Sources
Every source document behind the figures on this page, listed by publisher. The sources line under each section links each publisher to its document, and the dataset carries the verbatim quote and locator for every statistic.
Show all 744 sources
Loading the list of sources. It is also published as a file: JSON.
guaranteeAny PC, any Windows Buy now